Landmark Thematic Atlases
This section reads as would a biblical genealogy of sorts: Alexander von Humboldt taught Heinrich Berghaus and influenced Alexander Keith Johnston; Berghaus taught August Petermann; and Petermann collaborated with Berghaus and Johnston. More accurately, it reflects the passing on of the thematic torch lit by Humboldt. There were isolated “ignitions” throughout Europe before him—he, of course, was not the first to construct a thematic map or even to think of how one might do it—but every science needs a founding figure. More than anyone who preceded him, Humboldt provided that role.
![]()
Untitled map of Paris. Copperplate map, 35.3 × 46.8 cm. From Atlas administratif de Paris. The template for Maire's atlas maps.
Developments in urban cartography naturally embraced thematic mapping, for city administrations needed to understand, identify, and deliver services throughout their jurisdictions. Maps provided the visual aids. (See also Urban Planning in the Qualitative Thematic Maps section.)
Little is known about N. M. Maire, but he certainly had contacts in Paris’s 1820s government. In 1808, he self-published La topographie de Paris, ou, Plan détaillé de la ville de Paris et de ses faubourgs, a small city atlas containing twenty maps and 104 pages of alphabetical listings of streets and the addresses of public offices, hotels, hospitals, and other establishments of interest. According to his preface, a number of changes to street names followed an imperial decree of May 1806 (probably Napoleon’s demand for fifteen new public fountains and related construction projects)—hence, the need for such an updated work. Each of Paris’s twenty arrondissements (districts) has its own map in this atlas, but they are designed as individual parts of a larger city map. A key map, showing how the pieces fit together, is provided. Obviously, Maire was someone with cartographic experience who had good access to government information by the time he published his urban thematic atlas approximately a dozen years later: Atlas administratif de Paris.
Atlas administratif de Paris ([Paris: Lottin de St-Germain, 1828?]) [Marquand Art Library]. Seventeen copperplate maps, fourteen with added color, each 35.3 × 46.8 cm . Each map was printed with a blank round title cartouche in the upper right, to be pasted over with a different engraved title label. The first edition appeared in 1821, and only about a dozen copies of that have been catalogued in national databases.
First urban thematic atlas. It consists of fourteen copies of the same map of Paris, each devoted to a specific subject identified in the title cartouche (such as lighting districts, sewers, markets, firefighting districts); hand-coloring adds the visual thematic layer. Princeton’s copy also includes three blank, uncolored copies of the map bound in the back—reserved, presumably, for future topics.
The title page, lacking in Princeton’s copy, carries a dedication to the “le comte Anglès, ministre d’état, préfet de police” (Jules-Jean-Baptiste Anglès, comte, 1778–1828, French politician). The brief prefatory text acknowledges that several of the maps may be “aussi curieux pour l’amateur, que nécessaires pour l’administrateur”: essentially, the atlas is intended as a bureaucratic tool. Maire says, for example, that it is important to know where the sewer lines run before initiating construction projects.

Tracé des conduites d’eaux qui alimentent les fontaines de Paris.” Copperplate map, 35.3 × 46.8 cm, with outline color. From Atlas administratif de Paris.
The map traces the routes of water pipes that feed the various fountains in Paris. Four colors are used to indicate different water sources: Seine (via two pumping systems), Arcueil, and Ourcq.
“Plan lavé topographiquement de la ville de Paris.” Copperplate map, 35.3 × 46.8 cm, with added color. From Atlas administratif de Paris.
The four colors (besides the blue for water) indicate public edifices (gray, slanted lines), housing areas (pink), remarkable gardens (green), and promenades (pale orange).
Heinrich Karl Wilhelm Berghaus, 1797–1884
Heinrich Berghaus was born in the Prussian city of Kleve and was educated as a surveyor. He served in the Prussian army, became a geographical engineer employed in the War Department, and was assigned in 1816 to help conduct a trigonometrical field survey of the country. In 1821, he assumed an applied mathematics (surveying and geodesy) teaching post at a school in Berlin, which he held until 1854. Some of his first maps appeared in Hertha, a geographical journal that Berghaus cofounded and coedited, beginning in 1825. With the help of Alexander von Humboldt he established a geographical school (Geographische Kunstschule) in Potsdam in 1836. Future important mapmaker August Petermann (see his entry in this Landmark Thematic Atlases section) was one of his students.
Berghaus’s greatest achievement, originally intended to supplement Humboldt’s last work, Cosmos, was his Physikalischer Atlas (1845–1848). For the first time in an atlas, different physical aspects of Earth were represented graphically in maps, supported with tables of observed data. Throughout his life, Berghaus also published a number of scholarly texts on geographical subjects and was associated with several geographical journals. His lengthy correspondence (1825–1858) with Humboldt was published in three volumes in 1863. Berghaus died in Stettin, today’s Szczecin in Poland, in 1884.
Portrait of Heinrich Karl Wilhelm Berghaus. From Friedrich Beck and Eckart Henning’s Brandenburgisches Biographisches Lexikon (Potsdam: Verlag für Berlin-Brandenburg, 2002) [courtesy of Verlag für Berlin-Brandenburg].


Title page of Berghaus’s Dr. Heinrich Berghaus’ Physikalischer Atlas: oder, Sammlung von Karten, auf denen die hauptsächlichsten Erscheinungen der anorganischen und organischen Natur nach ihrer geographischen Verbreitung und Vertheilung bildlich dargestellt sind,2 vols. (Gotha: J. Perthes, 1845–1848[–1849]) [Historic Maps Collection].
The first great scientific physical atlas, which created a new genre of thematic atlases. This work represents the culmination of all the innovations in the different ways that people had looked at the geographic landscape of the world, and the evolving techniques that had developed to display those views, since the time of Francis Bacon. Issued gradually in eighteen installments over a dozen years (1837–1848), the first edition of the bound atlas consists of ninety maps in two volumes, dated 1845 and 1848, with individual maps dated from 1837 to 1848. Princeton’s bibliographically complicated copy appears to substitute some maps and text from the enlarged second edition (1849–1852). There are eight sections—meteorology and climatology, hydrology and hydrography, geology, terrestrial magnetism, botany, zoology, anthropology, and ethnography—representing both “hard” and “soft” sciences.

“Die Isothurmkurven der Nördlichen Halbkugel.” Lithograph map, with added color, diameter of 27.5 cm, on sheet 37 × 45.2 cm. From vol. 1 of Berghaus’s Physikalischer Atlas [Historic Maps Collection].
This is the second map of the first section of the atlas, devoted to meteorology. The subject is the mean temperature in the northern hemisphere, shown in a polar projection and circled with isotherms at 5° C intervals.

“Geographische Verbreitung der Menschen-Rassen.” Lithograph map, 16.7 × 28.3 cm, within larger border, on sheet 37 × 46 cm. From vol. 2 of Berghaus’s Physikalischer Atlas [Historic Maps Collection].
This is the first map of the seventh section of the atlas, devoted to anthropology. The design of the sheet, with surrounding head-portraits of men and women representing different human races, harkens back to the beautiful carte-à-figures maps of the Dutch golden age of mapmaking. However, a glimpse of the charts at the bottom confirm its scientific foundation.
Alexander Keith Johnston, 1804–1871
The Scottish novelist Sir Walter Scott described the Johnston clan as “a race of uncommon hardihood, much attached to each other and their chieftain” (Tales of a Grandfather: Being Stories Taken from Scottish History, 2nd ser., 1829). Their crest was a flying spur and their motto was “Ready Aye Ready.” Both were adopted by the Edinburgh publishing firm W. & A. K. Johnston, when it was formed in 1826 by the two Johnston brothers William and Alexander Keith. (William had started his own steel and copperplate printing business the previous year.)
Alexander Keith Johnston was educated at the Royal High School, Scott’s alma mater, and the University of Edinburgh. Though he originally intended to go into medicine, an early fascination with geography led him to an apprenticeship with the local engraving firm of James Kirkwood & Sons, where he had been preceded in that capacity by his brother. During hikes in the West Highlands in 1830, he found so many inaccuracies in the best maps of Scotland that he was eager for the Johnston brothers to make high-quality mapmaking their central business focus. In 1834, the firm was appointed as engravers to King William IV, an honor continued under Queen Victoria. With the publication of Alexander’s important National Atlas of Historical, Commercial, and Political Geography: Constructed from the Most Recent and Authentic Sources (1843), most of which maps he had personally engraved, the firm became “Geographers to the Queen.”
The work of Alexander von Humboldt introduced Alexander to the importance of physical geography. In 1848, with the assistance of August Petermann (see Petermann’s entry in this Landmark Thematic Atlases section), he produced the very substantial Physical Atlas, engraved and printed by the Johnston firm and published by William Blackwood & Sons. This was the pioneer work in English in this genre. The first edition was printed from a hand press and the second (1856) by means of lithography, though the plates were still hand-colored. His Royal Atlas (1861), containing forty-eight large maps (19.25 × 24 inches), became the standard-bearer of the firm and went through numerous revised editions.
William Johnston became lord provost of Edinburgh (1848–1851) and was knighted by Queen Victoria at the end of his term. He retired from the business in 1867. Alexander’s son, Keith Johnston (1844–1879), was a well-trained draughtsman and authored a number of geographical works, but he met an untimely death leading the Royal Geographical Society’s exploring expedition to Lake Nyasa in Africa.

Portrait of Alexander Keith Johnston. From One Hundred Years of Map Making: The Story of W. & A. K. Johnston (Edinburgh: W. & A. K. Johnston, 1925) [Historic Maps Collection].

Title page of Johnston’s The Physical Atlas: A Series of Maps & Illustrations of the Geographical Distribution of Natural Phenomena, Embracing: I. Geology. II. Hydrography. III. Meteorology. IV. Natural History. By Alexander Keith Johnston . . . with the Co-operation of Men Eminent in the Different Departments of Science (Edinburgh: W. Blackwood & Sons, 1849) [Historic Maps Collection]. The first printing of the atlas appeared in the previous year. Princeton’s copy is inscribed: “To the College of New Jersey who lately conferred the Degree in Divinity on the Revd John Somerville this volume is presented by a few of his friends in Glasgow January 1st 1856.”
First English atlas devoted to thematic maps, based on Heinrich Berghaus’s Physikalischer Atlas and dedicated to Alexander von Humboldt. Of the thirty maps, fifteen were designed by Berghaus but enlarged and revised by Johnston; the rest are Johnston’s original maps reflecting the latest work of scientific authorities. Preceding each double-page sheet are several pages of explanatory text and supporting tables of data.

“Outlines of Botanical Geography” and “The Geographical Distribution of Plants.” Engraved map and illustrations within one border, 47 × 55.2 cm, with added color. From Johnston’s The Physical Atlas (1849) [Historic Maps Collection]. On this sheet, Johnston incorporated and expanded data from both Humboldt and Berghaus.

“Geographical Division and Distribution of Aves (Birds) over the World” and “Geographical Division and Distribution of the Birds of Europe.” Engraved maps and illustrations within one border, 46.5 × 57.7 cm, with added color. From Johnston’s The Physical Atlas (1849) [Historic Maps Collection]. One of Johnston’s original thematic works.

Portrait of August Petermann. Frontispiece to The Popular Science Monthly 14, no. 2 (December 1878) [General Library Collection].
Born in the Prussian province of Saxony, August Petermann was destined for the ministry by his parents. However, proving at an early age to enjoy and excel in geography, particularly in drawing maps, he was admitted to the Geographische Kunstschule (School of Geographical Art) at Potsdam in 1839. The school had been started by Heinrich Berghaus, with the support of Alexander von Humboldt, just three years earlier, and Berghaus was Petermann’s instructor. Here, over the course of six years, he studied mathematical, physical, and political geography, ultimately becoming Berghaus’s assistant and collaborating on his mentor’s great Physikalischer Atlas.
For two years (1845–1847), Petermann lived in Edinburgh, where he had gone to assist Alexander Keith Johnston in producing an English adaptation of Berghaus’s atlas. The Physical Atlas: A Series of Maps & Notes Illustrating the Geographical Distribution of Natural Phenomena appeared in 1848. Then Petermann was drawn to London. During his seven-years’ sojourn in the city, he was elected to the Royal Geographical Society, wrote weekly geographical articles, helped Reverend Thomas Milner prepare the popular Atlas of Physical Geography (1850), and published a number of separate maps. In addition, he pressured for more government sponsorship of exploration, successfully getting German explorer Heinrich Barth appointed to join James Richardson on an expedition into central Africa. (Petermann’s maps later illustrated Barth’s published narrative.) Africa and the Arctic would become Petermann’s major geographic interests.
In 1854, he moved to Gotha, Germany, to work for Justus Perthes’s Geographical Institute, the most extensive map-publishing concern in the world. Here Petermann assumed editorship of a new geographical journal, Mittheilungen aus Justus Perthes’ geographischer Anstalt über wichtige neue Erforschungen auf dem Gesammtgebiete der Geographie von Dr. A. Petermann [Communications from the Justus Perthes Geographical Institute concerning important new studies in the whole field of geography, by Dr. A. Petermann] or PGM, a position he held until his death. His strengths were in the evaluation and analysis of cartographic information sources—not just blindly copying what others had produced—and he drew most of the maps for the first years of the journal.
Beyond their up-to-date geography, “Petermann school” (or “Gotha school”) maps were known for their precise lettering and drawing, use of elevation figures, and attractive coloring (many of their lithographed maps were hand-colored). In thematic maps, Petermann also encouraged his pupils to provide the underlying physical characteristics of the terrain. With its Petermann edition (the 6th, 1871–1875), the popular German world atlas Stielers Handatlas reached an unparalleled level of scientific achievement and world renown. Sadly, aggravating family and mental health issues caused Petermann to take his own life in 1878.
As his eminent career demonstrates, Petermann deserves to hold an important position in the history of cartography, not just in thematic maps.

Title page of the first issue of Petermann’s PGM (Gotha: Justus Perthes, 1855) [General Library Collection].
In his preface to the first issue, Petermann famously wrote: “Nie wird deshalb eine Nummer unserer Schrift ausgegeben warden, ohne eine oder mehrere Karten-Beilagen” (“No issue of our publication will ever appear without one or more map supplements”). Known as Petermanns geographischer Mittheilungen (PGM), the journal ceased publication in 2004. For perspective, consider that the Royal Geographical Society’s The Geographical Journal began in 1831 under the name of The Journal of the Royal Geographical Society and assumed its current title in 1893. The first issue of National Geographic appeared in October 1888.
![]() /
/
Initial subscription blank for Petermanns geographischer Mittheilungen, 1855 [Historic Maps Collection].
“Tafel 1” and “Tafel 2” [maps shown below]. Lithographed maps, with added color, from PGM, issue no. 1 (February 1855) [Historic Maps Collection].
These first maps from the first issue of the periodical, signed “A. Petermann,” show some of explorer Heinrich Barth’s travels in central Africa, including his trip to Tombouctou in September 1853. They supplement his article “Die Expedition nach Central-Afrika: I. Dr. H. Barth’s Reise von Kuka nach Timbuktu” on pages 3–14.


Portrait of Francis Amasa Walker as president of the Massachusetts Institute of Technology. From James Phinney Munroe’s A Life of Francis Amasa Walker (New York: Henry Holt, 1923) [General Library Collection].
Francis Amasa Walker, 1840–1897
Son of an economist, Francis Amasa Walker was born into a prominent Boston family and followed its well-worn path of public service. After graduation from Amherst College, he volunteered in a Massachusetts regiment to fight for the North in the Civil War. He rose quickly to the rank of assistant adjutant general but was captured by Confederate forces after the Richmond-Petersburg campaign and served time in Richmond’s infamous Libby Prison. Brevetted brigadier general after the war, Walker earned the contemporary appellation “General Walker.” (Medical men of the period attributed Walker’s early death to the strains and wounds of his military life and the miseries he experienced in the prison.)
Seeming recovery from the war took several years, during which time Walker assisted his father by taking over some of his lecturing duties at Amherst. He got married, started teaching at Williston Academy (Latin, Greek, mathematics), and studied economics in his spare time. In 1868, he joined the editorial staff of the Springfield Republican and was determined to follow a career in journalism. However, his family’s extensive network of contacts easily secured for him a federal appointment as chief of the Bureau of Statistics (1869–1870), where he became superintendent of the 1870 census.
Overcoming special difficulties caused by the disruption of the war—the demoralization of the South and the new status of blacks—the now-talented statistician created a landmark (for the United States) in the visualization of census data: the Statistical Atlas of the United States (1874). Afterward, he joined Yale’s economics faculty. In 1881, Walker accepted the presidency of the Massachusetts Institute of Technology, a position he held until his death. During that period, he was also president of the American Statistical Association (1882–1897), the first president of the American Economic Association (1885–1892), and vice president of the National Academy of Sciences (1891–1897).
Walker was a prolific author and made numerous contributions to economic theory. In recognition of his work, the American Economic Association, beginning in 1947, instituted the Francis A. Walker Medal for the lifetime achievement of an individual economist. This award was discontinued in 1982, having been overshadowed by the Nobel Prize for Economics.
Title page of the Statistical Atlas of the United States Based on the Results of the Ninth Census 1870: With Contributions from Many Eminent Men of Science and Several Departments of the Government, compiled under the authority of Congress by Francis A. Walker ([New York]: Julius Bien, 1874) [Historic Maps Collection].
First U.S. statistical atlas, hence, first real national atlas of the United States, where many important demographics are mapped for the first time. It consists of three sections: I. Physical Features of the United States; II. Population, Social and Industrial Statistics; III. Vital Statistics. Included in the last part are charts devoted to “the Afflicted Classes,” referring in the jargon of the period to the “blind, deaf mutes, insane, idiots.” In addition, the atlas contains essays on various subjects covered by the visual data—such as woodlands and forest systems, mines and mining in the West, political divisions, population, relation of race and nationality to mortality—authored by, as the title states, “eminent men of science.” There are sixty full-page plates, though double-page maps are counted as two plates. Many of the maps cover only the region of the country that is east of the Mississippi River, for there were only thirty-seven states in 1870. Congress authorized an edition of five thousand copies, to be distributed to public libraries, learned societies, colleges, and academies to promulgate the study of political and social statistics. The atlas was awarded a first-class medal at the 1875 International Geographical Congress in Paris.


“Geological Map of the United States Compiled by C. H. Hitchcock and W. P. Blake.” Lithograph map, 48.5 × 70.5 cm, comprising plates XIII and XIV of the Statistical Atlas (1874). [Compare to the William Maclure map of 1817 in the Geology section.]

“Map Showing the Proportion of the Colored to the Aggregate Population. Compiled from the Returns of Population of the Ninth Census of the United States 1870. By Francis A. Walker.” Lithograph map, 49 × 36.5 cm. Plate XXII of the Statistical Atlas (1874).
This thematic map recognizes six levels of black population density (in number of inhabitants per square mile): less than 1, 1–7, 7–17, 17–35, 35–60, 60+. Dark blue lines indicate the boundaries of groups of population where the number of black inhabitants per square mile is expressed in ranges: 2–18, 18–45, 45+. The shaded blue lines indicate boundaries beyond which the population density is less than two inhabitants per square mile. The 1870 census was the first survey in which emancipated African Americans were fully counted.
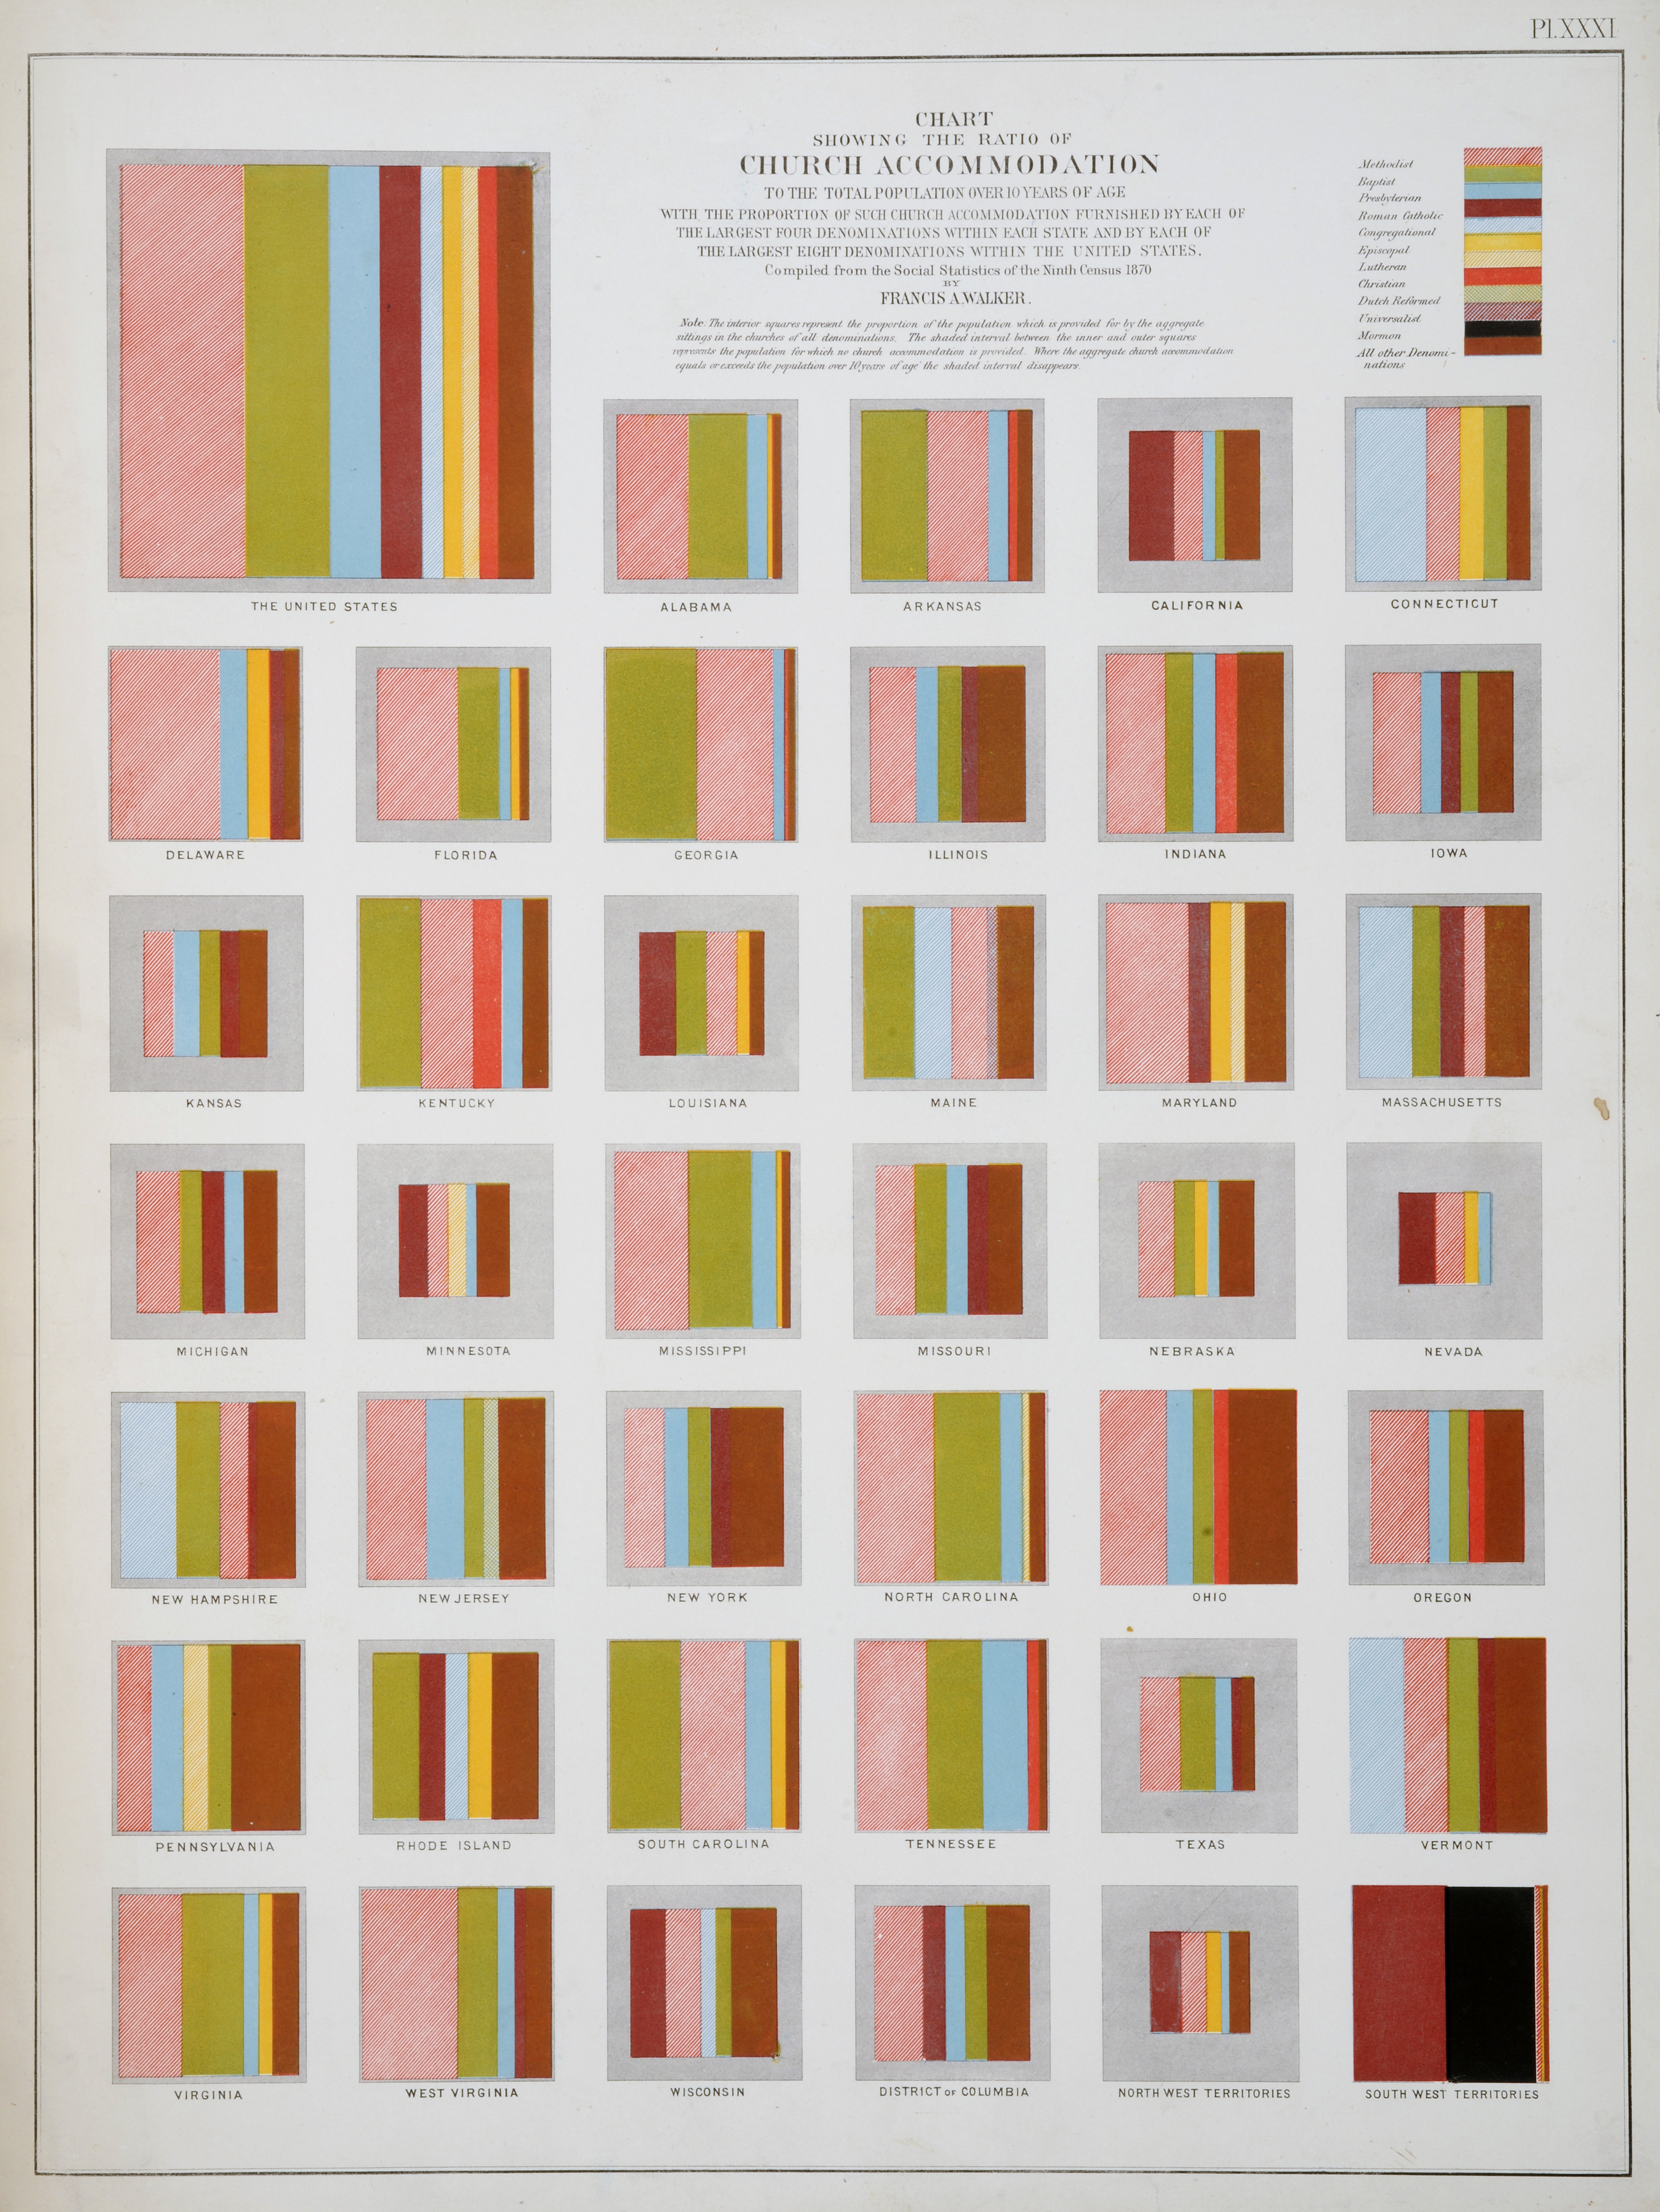
“Chart Showing the Ratio of Church Accommodation to the Total Population over 10 Years of Age with the Proportion of Such Church Accommodation Furnished by Each of the Largest Four Denominations within Each State and by Each of the Largest Eight Denominations within the United States. Compiled from the Social Statistics of the Ninth Census 1870 by Francis A. Walker.” Lithograph chart, plate size 50.4 × 37.7 cm. Plate XXXI of the Statistical Atlas (1874).
For the purposes of comparison here, each state’s square is the same size. Nationally, in order of predominance, the named denominations are Methodist, Baptist, Presbyterian, Roman Catholic, Congregationalist, Episcopal, Lutheran, Christian, Dutch Reformed, Universalist, and Mormon. The size of the gray border of each square represents that proportion of the state’s over-age-ten population that is not affiliated with any church. The squares for Ohio and Vermont, having no such border, suggest an accommodation of 100 percent—meaning, apparently, that everyone over the age of ten went to church in those states.

“Fiscal Chart of the United States Showing the Course of the Public Debt by Years 1789 to 1870. Together with the Proportion of the Total Receipts from Each Principal Source of Revenue and the Proportion of Total Expenditures for Each Principal Department of the Public Service, Compiled from the Report of the Secretary of the Treasury for the Year 1872, by Francis A. Walker.” Lithograph chart, plate size 37.7 × 50.2 cm. Plate XXXV of the Statistical Atlas (1874). [Compare to William Playfair’s chart of England’s debt in the Sociology and Economics section.]
Walker chose to equate receipts with expenditures and to treat each year’s inflow and outflow as the same in order to emphasize relative aspects rather than absolutes. In 1866, for example, receipts were 170 times those for 1789, but they are visually represented as equal. Some of the more obvious conclusions one can draw from the three parts of this chart:
- Revenue: reliance on customs (trade) dollars until the rise of internal revenue sources in 1862, when President Abraham Lincoln and Congress created an income tax to pay for war costs.
- Expenditures: military expenses loom large, expanding during the Civil War, then competing with the rising interest costs of the national debt.
- Public debt: a visual “drip” grows into a huge “pool.” The year of least debt (narrowest point) was 1835, when the total amount had shrunk to $37,513!


“Chart Showing the Distribution by Age and Sex of Insanity” and “Chart Showing the Distribution by Age and Sex of Idiocy.” Both prepared by Fred H. Wines, secretary of the Illinois Board of Charities, from the Ninth Census 1870. Lithograph charts, each plate 20.8 × 37 cm. Top halves of Plates XLIX and L of the Statistical Atlas.
These innovative graphic figures split the reporting population in half, with males on the left and females on the right. Each decade is represented by a horizontal line, and its length outward from the center indicates the relative number of the subjects in question. The sex that predominates is shaded. Accordingly, in 1870, there were more “insane” females than males, but more “idiotic” men than women; the atlas does not define this terminology.