Sociology and Economics ("Moral Statistics")
Probably the most intuitive areas for thematic map use are the social and economic environments, where subjects like trade, population, crime, and poverty come readily to mind. And these are also the areas where governmental bodies and institutional organizations historically focused their initial statistical efforts. But who first was responsible (where and how) for making this kind of information available visually in charts and maps?
An opportunist, a scoundrel, a genius—William Playfair tried and failed at many things in his life but left a permanent mark on statistical graphics, pioneering the way that we have visualized data ever since. A chart of his own life would show a line spiraling downward across the axis of years, asterisked with explanatory text:
- Educated by older brother John after the death of his Scottish clergyman father when he was thirteen (John would become a distinguished geologist and mathematician).
- Served an apprenticeship with James Watt, of steam engine fame.
- Failed with a silversmith and plate-making business he had set up with a partner.
- Tried to develop a rolling mill in France with Louis XVI’s approval.
- Lived in France at the time of the French Revolution and assisted in the storming and capture of the Bastille.
- Partnered with Joel Barlow (American lawyer and poet) in the Scioto Land Company, which attempted to establish French settlers along the Ohio River but subsequently collapsed amid embezzlement charges.
- Failed with a London bank he had co-partnered.
- Edited short-lived publications (a daily paper and a weekly).
- Was convicted of swindling.
- Edited the first critical edition of Adam Smith’s Wealth of Nations.
- Attempted extortion.
Playfair never realized the “grand scheme.” But in his lifetime he wrote more than a hundred pamphlets and books. In 1786, he produced The Commercial and Political Atlas, the first publication to contain statistical charts (but no maps), including the first bar graph and line graphs. (These latter were probably inspired by Joseph Priestley’s chronological diagrams, which Playfair had seen.) In 1801, Playfair published The Statistical Breviary, which included the first pie chart, using different size slices to represent the extent of their corresponding geographical regions. None of these graphic innovations was recognized as a major achievement by his countrymen. Abroad, however, he had important supporters. Presented with a copy of Playfair’s Atlas, French King Louis XVI thought the charts were very clear and readily understandable. German naturalist-geographer Alexander von Humboldt acknowledged his debt to Playfair in his Political Essay on the Kingdom of New Spain (1811) in which he graphed, in a similar manner, the silver and gold mining operations of Mexico.
Playfair died in poverty. His obituaries made no mention of his graphical inventions, concentrating, instead, on his unpopular political and economic writings. One of his sons emigrated to Canada, became prominent and successful, and founded the town of Playfairville in Ontario. Two centuries after Playfair’s death, the pie chart, bar graph, and line graph remain fundamentally the same—and they are universally ubiquitous.
Title page of The Commercial and Political Atlas: Representing, by Means of Stained Copper-plate Charts, the Progress of the Commerce, Revenues, Expenditure and Debts of England during the Whole of the Eighteenth Century, 3rd ed. (London: T. Burton for J. Wallis, etc., 1801) [Rare Books Division]. The first edition had appeared in 1786; the second in 1787.
As knowledge increases amongst mankind, and transactions multiply, it becomes more and more desirable to abbreviate and facilitate the modes of conveying information from one person to another, and from one individual to the many [p. vii].
This is not a quote from a current smartphone advertisement; rather, it is how Playfair begins the third edition of his landmark work, which he felt necessary to update because of the great change “operating in Europe”—certainly a reference to the French Revolution and its aftereffects. To him, the reasons for new and improved graphic representations were clear (as they continue to be today): they enabled him to give form and shape to abstract ideas.
That I have succeeded in proposing and putting into practice a new and useful mode of stating accounts, has been generally acknowledged, that it remains only for me to request that those who do not, at the first sight, understand the manner of inspecting the Charts, will read with attention the few lines of directions facing the first Chart, after which they will find all the difficulty entirely vanish, and as much information may be obtained in five minutes as would require whole days to imprint on the memory, in a lasting manner, by a table of figures [p. xii; his emphasis].


"A Map of France with the Proposed Divisions." Copperplate map, with added color, 35.1 × 31.9 cm. From Playfair's Thoughts on the Present State of French Politics and the Necessity and Policy of Diminishing France, for Her Internal Peace, and to Secure the Tranquillity of Europe (London: Printed for John Stockdale, 1793) [Rare Books Division].
Grown disenchanted with the revolutionaries, Playfair became a resolute Royalist. His attitude on the French Revolutionary Wars is made abundantly clear with these words printed under his name on the title page: "The French Democrats will be like other Madmen, they have begun by insulting and attacking all their Neighbours, and will finish their Career in a strait Waistcoat." His thematic map proposes a solution to the current danger of France's revolutionary fever: break the country up and offer pieces of its territory to neighboring states "as an indemnity for expenses occasioned by France"; then reconstitute its diminished state under the House of Bourbon.
“Exports & Imports to and from All North America.” Copperplate chart, with added color, 8 × 15.4 cm. Plate 5 from Playfair’s The Commercial and Political Atlas (1801) [Rare Books Division].
This chart dramatically exhibits the effect of the American Revolution on trade between England and its former colonies: brought to a standstill during the war, it quickly recovered and expanded. In his accompanying notes, Playfair argues that his country’s idea of keeping America “in a state of dependence was rapacious, impolitic, and unjust” [p. 22], for England’s trade advantage is now greater than ever.


[Above] “Chart of the National Debt of England.” Copperplate chart, with added color, 15.3 × 8.4 cm. Plate 20 from Playfair’s The Commercial and Political Atlas (1801) [Rare Books Division].
Similarly, in this chart, inferences are clear: wars increase national debt. Playfair is not content with drawing obvious conclusions, however. His observations are as keenly relevant today as they were when he published them over two hundred years ago:
The effect, which is before us in the chart, is the natural one of perpetual loans; for though it might have been managed a little better, or a little worse, as long as it continued upon this plan, it must have increased, unless as much money had been levied in time of peace, as would pay off the debt contracted in the previous war; but if this were done, it would be the same with annuities, because it would be raising taxes to pay off, at a certain time, the capital of the debt. That, however, has not been done, except, during this last war, content with getting possession of the money, we have left to future generations the trouble of repaying it [p. 85].
And he concludes with the prediction that heavy taxation will result in the “general penury of the middle and lower classes” [p. 86]. [Compare to Francis Amasa Walker’s U.S. public debt chart of 1870 in the Landmark Atlases section.]
[Above] “Chart Representing the Reduction of the National Debt by the Sinking Fund, Already Established.” Copperplate chart, with added color, 15.3 × 8.4 cm. Plate 21 from Playfair’s The Commercial and Political Atlas (1801) [Rare Books Division].
Playfair’s companion chart to the previous one, with the same dimensions, allowing the viewer to make an exact comparison. Governments and corporate bodies establish sinking funds, primarily from surpluses, to retire debt. Great Britain first used them in the eighteenth century, but its war with France in the 1790s greatly limited their viability—and this projection of Playfair proved more wishful than useful.

“Chart Shewing the Value of the Quarter of Wheat in Shillings & in Days Wages of a Good Mechanic [i.e., smith, mason, carpenter] from 1565 to 1821.” Copperplate chart, with added color, 13.5 × 28.7 cm. From Playfair’s A Letter on Our Agricultural Distresses, Their Causes and Remedies: Accompanied with Tables and Copper-plate Charts, Shewing and Comparing the Prices of Wheat, Bread, and Labour, from 1565 to 1821. Addressed to the Lords and Commons (London: Printed for William Sams, 1821) [Rare Books Division].
This is one of Playfair’s final works, an interesting example of his smaller publications addressing national economic issues.
I have adopted, for the sake of illustration, the method I invented nearly forty years ago, of representing, by charts and diagrams, the progress and proportional amounts of prices; that method having met with much approbation on the Continent, and Baron Humboldt [Alexander von Humboldt] having declared it to be the best mode of impressing on the mind proportional quantities.—The unqualified approbation of that great philosopher and traveler is deemed a sufficient reason for adopting that mode of illustration on this important subject [p. iv].
His graph argues his point, which he presents “[f]or the sake of putting an end to mistaken theories, and to shew that the wages of labour never bore so favourable a proportion to the price of wheat as they do at this time” [pp. 51–52]. Wages equivalent to seventy-three days of work were required in Queen Elizabeth’s time to buy the same amount of wheat as that purchased with less than fourteen days during the reign of George IV.

“Linear Chronology, Exhibiting the Revenues, Expenditure, Debt, Price of Stocks & Bread, from 1770 to 1824.” Copperplate chart, with added color, 12 × 39.4 cm. From Chronology of Public Events and Remarkable Occurrences within the Last Fifty Years; or from 1774 to 1824 (London: G. and W. B. Whittaker, 1824) [Rare Books Division].
This volume was intended to be a perpetual publication, adding a year on at the end while removing one from the beginning, so that it would continually present a record of the last fifty years. Here, Playfair’s popular time line has been extrapolated beyond his death (1823) for another year.

Caricature of Charles Dupin by Honoré Daumier, published in Le Charivari (Paris) on 18 June 1849, from his series on French legislators [Graphic Arts Collection].
The middle son of a French lawyer and legislator, Charles Dupin made his mark in mathematics, economics, and education. In 1803 he graduated from the École Polytechnique (Paris) as a naval engineer; among early assignments, he restored France’s damaged arsenal on the island of Corfu (1808-1811) and exhaustively toured English commercial and military dockyards and installations to report (in six volumes) on their technical advances. He made numerous contributions in the field of geometry, including the “Dupin cyclide,” the “Dupin indicatrix,” and “Dupin’s theorem.” From 1819 to 1854, he was professor of mechanics at the Paris Conservatoire des Arts et Métiers, where his free public lectures on mathematics and mechanics were very popular. King Louis XVIII made him a baron in 1824. In later life, Dupin was active in politics, becoming a member of the senate in 1852. He was a strong advocate for the construction of schools, roads, and canals, and favored the use of steam power. Among his many writings on economic topics, none had a more powerful impact than his detailed study of French commercial activity (2 vols., 1827). Its associated chloropleth map on public education, a key to prosperity, provided a new vista for viewing sociological data.


Autograph letter by Dupin to George Richardson Porter, director of the statistical office of the British Board of Trade, dated 7 September [or October?] 1836, Dover [England] [Wild Autograph Collection, Manuscripts Division].

Title page of vol. 1 of Dupin’s Forces productives et commerciales de la France (Paris: Bachelier, 1827) [General Library Collection].
The first work with a thematic map on “moral statistics.”(Unfortunately, many copies lack the important map.) Princeton’s copy is inscribed by Dupin on the half title page [see above].

Dupin had recently attended the August meeting of the Statistical Section of the British Association for the Advancement of Science in Bristol, England, presenting a paper on the relationship of the price of grain to population growth in France. He found that price had no influence on the number of births or deaths. Two days later,
The Baron Dupin exhibited a map of England, illustrating the proportion of crime to the density of population, from which it appeared that the ratio of crime generally increased proportionally with that of density, especially in offences against property [Proceedings of the Statistical Society of London, 1, no. 8. (1836-37): 190].
In this letter to Porter, Dupin admits to not having had the time to arrange with “Mr. Ch Knight” for the printing of his comparative map on population and criminality—this task he leaves to Porter. (Charles Knight was the publisher of the Society’s journal and a number of other important publications. Apparently, the map was never published, for no copy is known.) In addition, Dupin reminds Porter that he was promised statistical data “for this year” on Britain’s finance, army, and navy.
Trying to understand the social transformations that were underway in early Victorian society motivated statisticians and public reformers in England to form several statistical societies in the 1830s. These developments were influenced by their European counterparts like Frenchman Dupin and, even more directly, by the Belgian Adolphe Quetelet. (See his entry in this Sociology and Economics section.) Dupin’s letter illustrates the cross-fertilization of this period
André-Michel Guerry, 1802–1866
An only child, A. M. Guerry broke from the usual family pattern of blue-collar work and became a lawyer. Around 1825, he was admitted to the bar in Paris as a royal advocate (prosecutor). Soon afterwards he began working in the Ministry of Justice on crime statistics drawn from the Compte générale de l’administration de la justice. Commissioned by the Ministry in 1825, this was a massive project to compile criminal justice data for the whole nation, the first centralized system of its kind, a forerunner of modern national crime databases. These statistics became Guerry’s life’s work, for he realized their importance in developing public policy. He abandoned law to devote himself exclusively to analyzing and interpreting this data and gathering additional data on his own. He was appointed the Ministry’s director of criminal statistics after the Revolution of 1830.
Guerry’s publications based on his statistical research gained widespread attention. His first was a collaborative effort (1829) with the Italian geographer and ethnographer Adriano Balbi (1782-1848), a large broadside containing three thematic maps of France: crimes against persons, crimes against property, and literacy. The relationship between crime and education was a particular interest for him. His magnum opus was a comparative study of England and France using “moral statistics”: Statistique morale de l'Angleterre comparée avec la statistique morale de la France, d'après les comptes de l'administration de la justice criminelle en Angleterre et en France, etc. (Paris, 1864). It was awarded the French Academy of Sciences’ grand prize in statistics.
Title page of Guerry’s Essai sur la statistique morale de la France, précédé d’un rapport à l’Académie des sciences, par MM. Lacroix, Silvestre et Girard (Paris: Crochard, 1833) [Historic Maps Collection]. Note that Guerry quotes Sir Francis Bacon’s famous aphorism here.
First use of the term “moral statistics”: what today would fall under the umbrella of sociology. In his introduction, Guerry makes reference to the authoritative words of Alexander von Humboldt and William Playfair to help justify his reasons for employing new graphical techniques to display his data—but that perhaps is not necessary, he believes, for the results are striking and speak for themselves. He does not subscribe to any theory; rather, he identifies his information sources so that others may be assured of his exactitude and sincerity.
The basic conclusion that Guerry draws, convincingly—after the presentation of all of his statistics and maps—is that
. . . la plupart des faits de l’ordre moral, considérés dans les masses, et non dans les individus, sont déterminés par des causes régulières, dont les variations sont renfermées dans d’étroites limites, et qu’ils peuvent être soumis, comme ceux de l’ordre matériel, à l’observation directe et numérique [p. 69]. [On a population basis, most facts related to the “moral sphere” have recurring causes whose exceptions are narrowly confined, and that can be analyzed, as they are in the physical world, by statistical observation.]
Here is a strong and early advocacy of the “science” in social sciences. The volume was awarded the 1833 Prix Montyonfor statistics and remains a foundational study of criminology and sociology.


[Above] “Crimes contre les personnes.” Lithograph map with data table, 25.6 × 20 cm. Plate I from Guerry’s Essai sur la statistique morale de la France . . . (1833) [Historic Maps Collection].
A chloropleth map, a form pioneered by Charles Dupin (see his entry in this Sociology and Economics section) which uses gradations of shading to show changes in levels of data. Here, from dark brown to white, the shades of the eighty-six administrative departments of France reflect six to seven different levels of crime against persons (as opposed to crimes against property, the subject of another map). Moreover, the departments are numbered in order of crime rate, from highest to least. The exact crime numbers for the specific departments are provided in the table at the bottom. Visually, one easily can see that the southern regions of France, and those directly bordering Germany, have the most crime. Corsica has the highest rate of all: 1 out of every 2,199 people has been accused of committing a crime against someone else. In the accompanying text, Guerry provides a table showing how the rate of this kind of crime has grown for each of five regions (south, east, north, west, central) over the years from 1825 to 1830. The average rate for France as a whole for the six-year period was 1 crime per 17,085 inhabitants.
[Above] “Donations aux pauvres.” Lithograph map with data table, 25.6 × 20 cm. Plate V from Guerry’s Essai sur la statistique morale de la France . . . (1833) [Historic Maps Collection].
A similar chloropleth map utilizing data taken from the government’s Bulletin des lois, showing the frequency of donations/bequests to the poor per number of residents. (This is independent of the value of each gift.) An interesting detail that strikes one immediately, in comparison with the previous map, is that Corsica has the fewest number of such gifts but the highest crime rate (learned from the other map). Guerry notes that donations are higher in regions where Catholic clergy are more widespread. These kinds of “relationships”—if, indeed, there is one—are amplified in a thematic map.


[Above] “Suicides.” Lithograph map with data table, 25.6 × 20 cm. Plate VI from Guerry’s Essai sur la statistique morale de la France . . . (1833) [Historic Maps Collection].
Another chloropleth map based on the unpublished data on suicides in Paris that Guerry collected over many years as well as official records published in the Compte générale de la justice criminelle for the years 1827 to 1830. (Reported suicides, Guerry argues, are fewer than those known.) The map confirms what one might expect: the highest suicide rate is in Paris (Seine department); in fact, the rate increases as one approaches the capital. However, what is remarkable about this phenomenon, according to Guerry, is that it does not seem specifically related to population density, level of education, distribution of clergy, or level of crime in the surrounding districts—only their proximity to Paris. If men like Voltaire and Montesquieu cannot agree on the cause of suicide, Guerry says that he will not presume to know the reason—yet. Clearly, he concludes, more study is needed.
[Above] “Résultats divers.” Plate VII from Guerry’s Essai sur la statistique morale de la France . . . (1833) [Historic Maps Collection].
A tabular rendition of various different views of Guerry’s moral statistics: crimes against persons and property by sex and then by month, type of murder victim following adultery (for example, “outraged husband” or “wife’s lover”), literacy by region, and suicides by age and method (gun or hanging). Except for the literacy graph, there are no geographical aspects to the data, hence no possibility for thematic map versions.

Portrait of George Poulett Scrope. From vol. 2 of Sir Archibald Geikie’s Life of Sir Roderick I. Murchison . . . (London: J. Murray, 1875) [General Library Collection].
George Poulett Scrope, 1797–1876
George Poulett Scrope is best known as a geologist who specialized in, and made notable contributions to, the study of volcanoes. He explored volcanic regions in Italy and France and, in fact, was present at the 1822 eruption of Mt. Vesuvius. His work Considerations on Volcanos (1825), later amplified and retitled Volcanos (1862), was a classic textbook on the subject, promoting a theory of the earth born out of fire (volcanism) rather than water (neptunism, the crystallization of minerals from the oceans). Scrope believed that present volcanic processes provided windows into the past. In 1867, he was awarded the prestigious Wollaston Medal by the Geological Society of London (see also the William Smith entry in the Geology section).
Born George Julius Poulett Thomson, Scrope changed his surname after marrying heiress Emma Phipps Scrope in 1821. For more than thirty years, he held a seat in the British House of Commons, where his major interests were political economy and welfare economics. He authored several dozen papers and pamphlets, but his most important theoretical work was Principles of Political Economy, Deduced from the Natural Laws of Social Welfare, and Applied to the Present State of Britain (1833). Considering himself a man of the people, he dedicated the book to his constituents: “Mutual regard, reciprocal confidence, and a general agreement on political principles, now form the bond of union between a parliamentary trustee and those who appoint him” [p. v]. Though much of what he writes has a relevant, contemporary air, the work has received more attention—at least from cartographic quarters—for its innovative world map.
“Map Exhibiting the Comparative Extent of the Fully-Peopled, the Under-Peopled, and the Yet Un-Peopled Parts of the Earth.” Lithograph map, 7.4 × 11.5 cm. Frontispiece to Scrope’s Principles of Political Economy . . . (London: Longman, Rees, Orme, Brown, Green & Longman, 1833) [Historic Maps Collection].
First world map to show population density. Scrope divides the land area into regions “averaging more than 200 inhabitants to the square mile” (black), “from ten to 200” (gray), and “less than ten inhabitants & rarely so much as one” (blank). Where he acquired his data is not given, and the map is not mentioned in the book.


Portrait of Adolphe Quetelet. From Annuaire de l’Académie royale des sciences, des lettres et des beaux arts de Belgique 41 (1875): 108 [General Library Collection].
Belgian mathematician Adolphe Quetelet was among the first to apply probability and statistics to social phenomena in order to better understand the underlying causal factors. He was extremely influential in the development of European social science. His research interests also included astronomy and meteorology, and he succeeded in raising public and private funds for the building of an observatory in Brussels, which he then directed for the rest of his life.
In the early 1830s, Quetelet had an important role in forming the Statistical Section of the British Association for the Advancement of Science and the Statistical Society of London (now the Royal Statistical Society); he was the first foreign member of the American Statistical Association, founded in 1839. In 1853, he organized the first international statistics conference, held in Brussels. From 1834 onward, Quetelet served as secretary to Belgium’s Royal Academy of Sciences.
One of Quetelet’s best-known contributions, still used internationally today, is the concept of a body mass index, also called the Quetelet Index (QI). This is a simple mathematical tool that classifies a person’s weight in comparison to an ideal weight for that person’s height. The formula is QI = weight (in kilograms) / height (in meters)2. Anyone with a QI that is greater than 30 is considered to be officially obese. The formula has had a significant role in fostering public health debates.

“Cartes figurative: Crimes contre les propriétés / Crimes contre les personnes.” Two lithograph maps within one border, 21.5 × 33 cm. From Quetelet’s Sur l’homme et le développement de ses facultés; ou, Essai de physique sociale, 2 vols. in 1 (Brussels: Louis Hauman, 1836) [Historic Maps Collection].
Landmark chloropleth maps on crime in France, showing a smoother, seamless distribution in their graphic presentation than those exhibited in similar maps by fellow countryman A.-M. Guerry [see his entry in this Sociology and Economics section]. These were originally published in 1831.
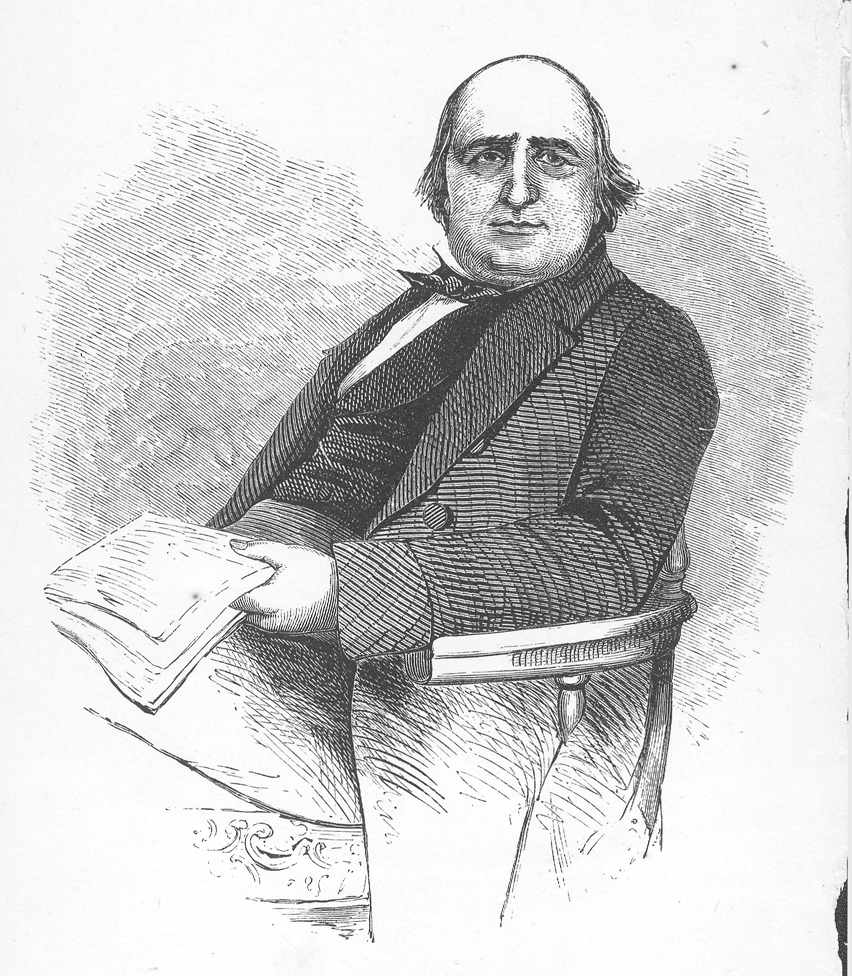
Adolphe d’Angeville, 1796–1856
Son of a landowner in the Jura region of France bordering Switzerland, Adolphe d’Angeville spent his youth as a naval officer. His sister Henriette in 1838 became the second woman to climb Mont Blanc. From 1834 to 1848, d’Angeville held a seat in the Chamber of Deputies, the lower house of the French parliament. He synthesized data collected in Paris before and during that period into his great statistical work, Essai sur la statistique de la population française, considerée sous quelques-uns de ses rapports physiques et moraux (1836). This is now considered to be the first sweeping application of thematic cartography to national industrial and population data. However, during the French Revolution of 1848, d’Angeville returned to his family estate and met a jeering crowd that threw rocks at him and called him a malthusien (after Thomas Robert Malthus, the influential English demographer), which was then a great insult. Clearly, his work was not understood or appreciated in his time.
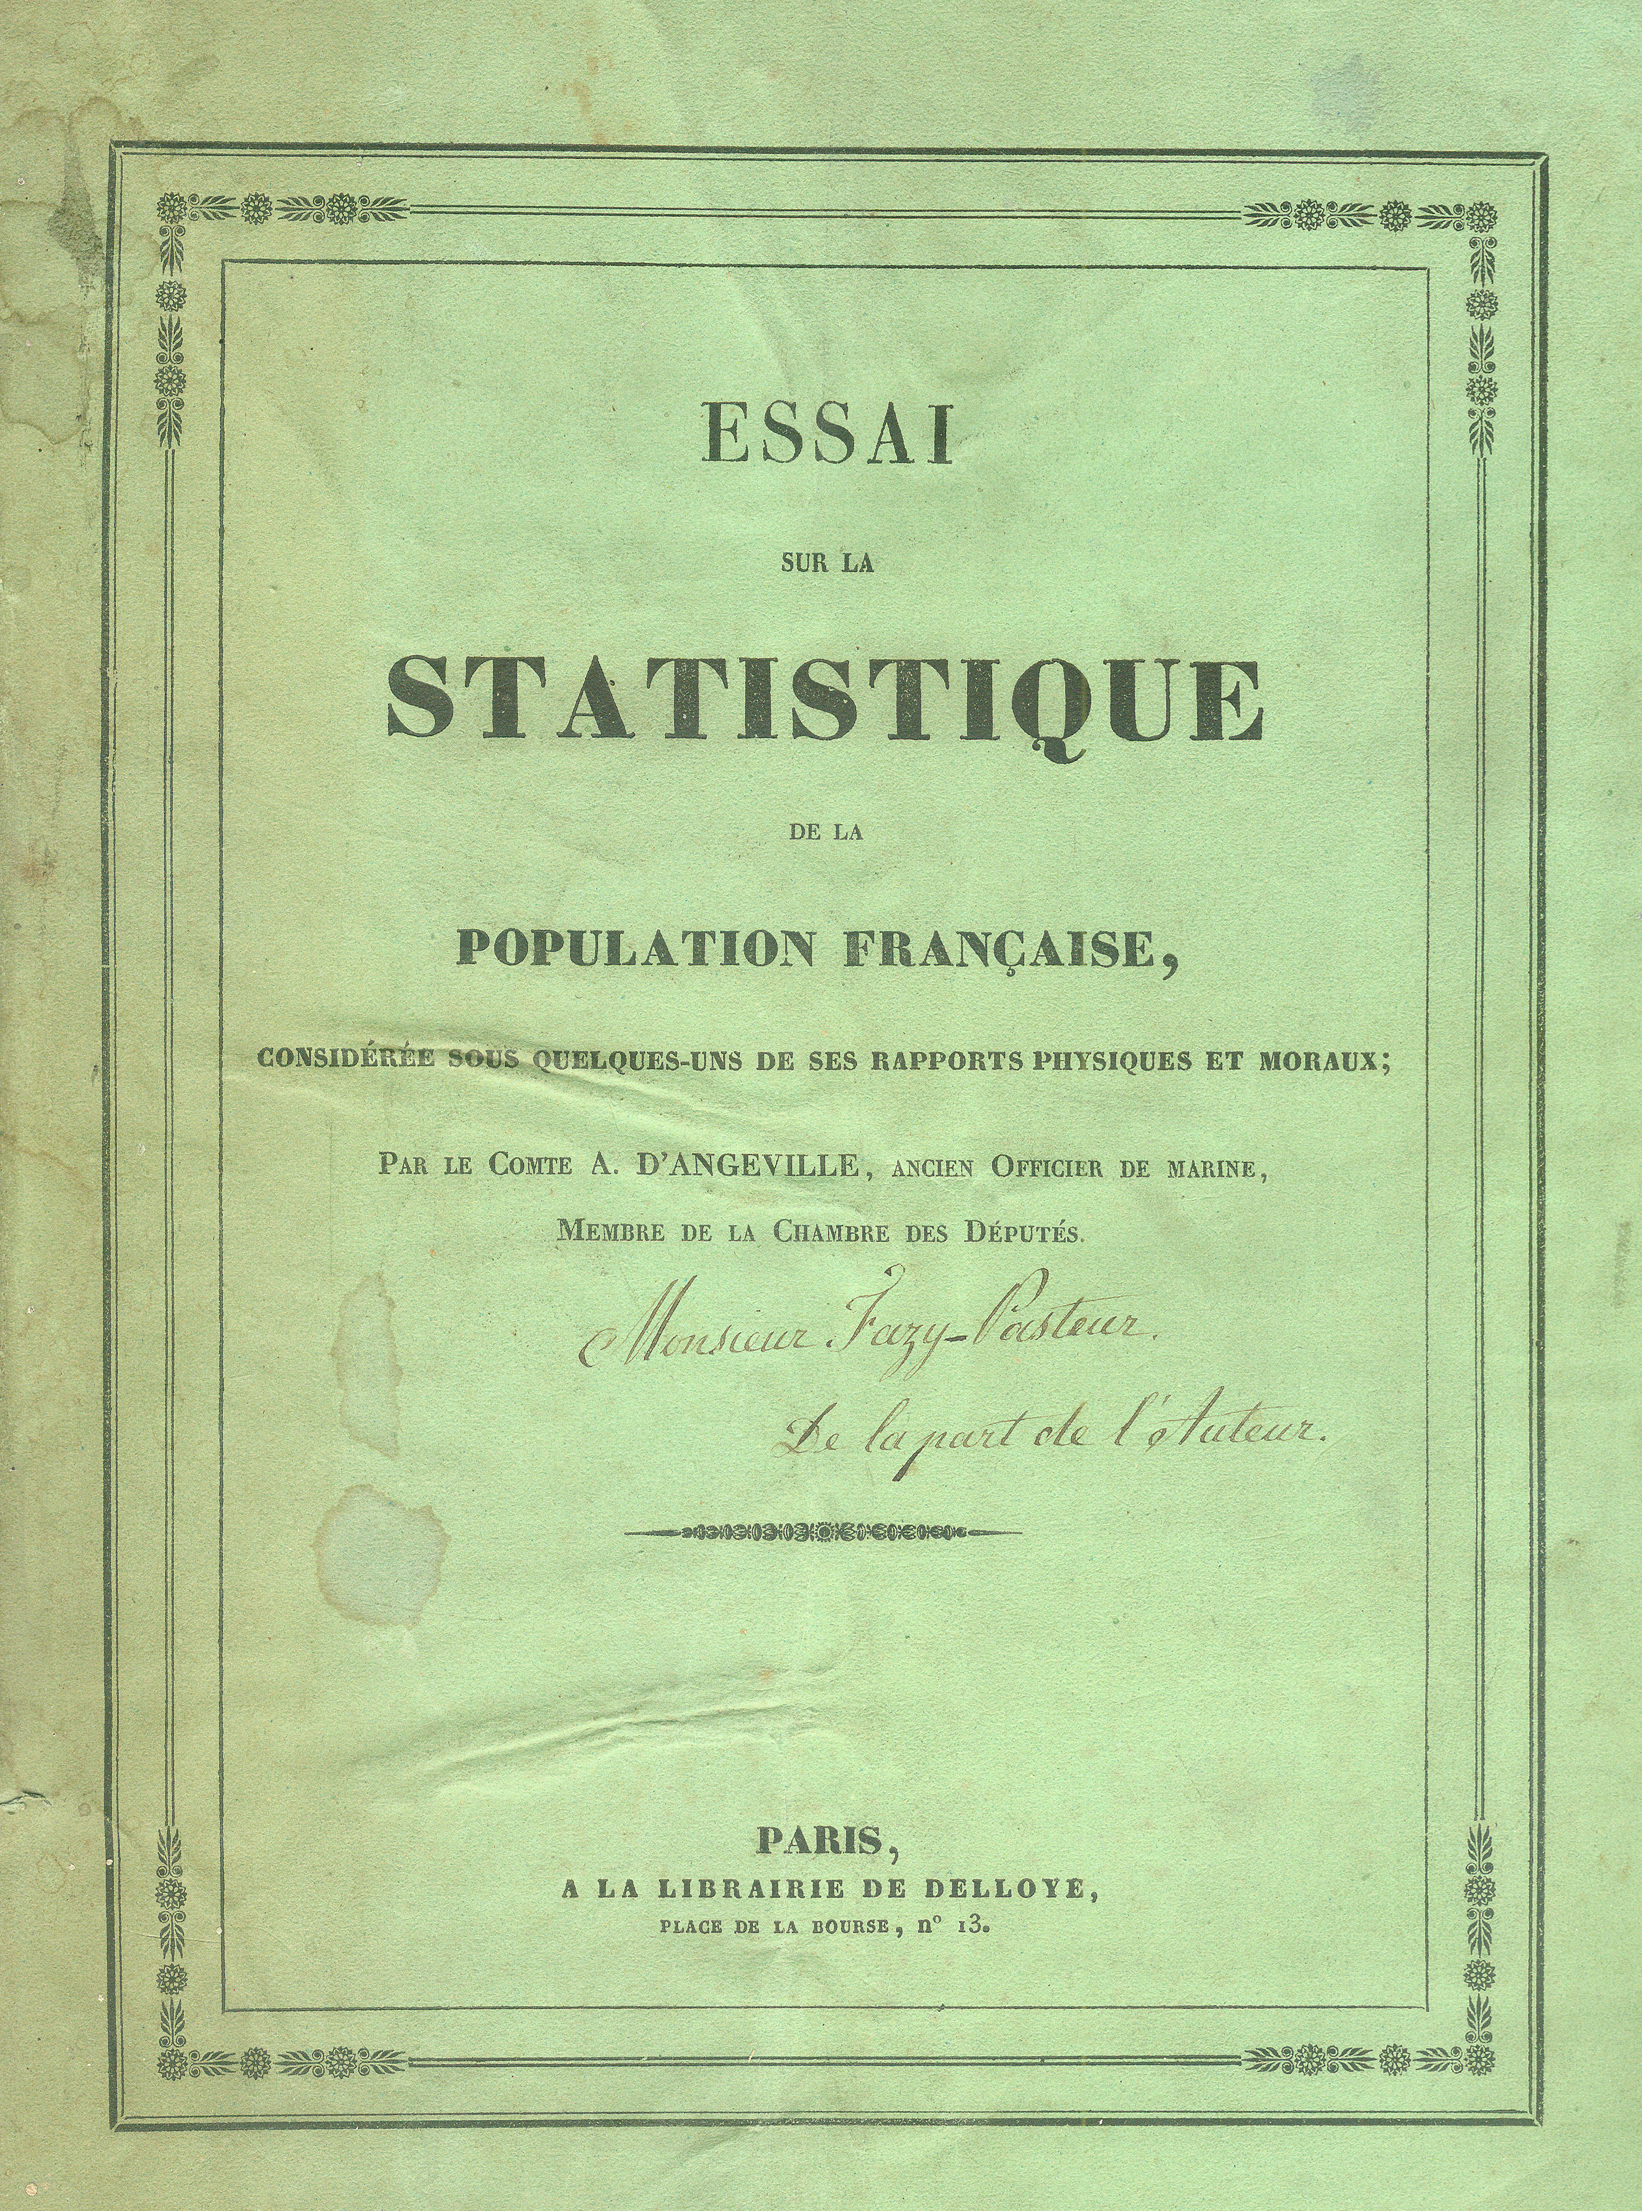
[Right] Title page of d’Angeville’s Essai sur la statistique de la population française, considerée sous quelques-uns de ses rapports physiques et moraux (Bourg: Impr. de F. Dufour, 1836 [i.e., 1837, appendix dated “juin 1837”]) [Historic Maps Collection].
Presentation copy to Monsieur Fazy-Pasteur with inscription by the author.

“Statistique de la population française. 1re. Carte.” Lithograph map, 24.1 × 19.1 cm. From d’Angeville’s Essai sur la statistique de la population française . . . (1836)[Historic Maps Collection].
One of the earliest chloropleth maps of population density. Using data from 1831, d’Angeville calculated density values for square myriamètres (kilometers) and then graphically displayed the results on his map by using darker shades/denser patterns for denser regions. Five different levels of density are shown; regions with close density values share the same shading. Crediting the example of fellow statistician Charles Dupin [see his entry in this Sociology and Economics section], d’Angeville praises the effect of this graphic representation of data:
Le moyen de parler auz yeux, que nous avons employé dans la 4me. Partie [the map section], . . . c’est que nous avons éprouvé souvent combien les moyens graphiques suppléent à l’aridité des enumerations; on arrive ainsi sans aucune fatigue d’esprit [p. 15]. [Speaking to the eyes with graphic methods avoids the aridity of numbers that fatigues the spirit.]
D’Angeville applies the same chloropleth technique in fifteen succeeding maps dealing with other sociological aspects of the French population, such as life expectancy, completion of primary education, level of crime, and illegitimate birth rate. An unusual statistic that he maps is the number of doors and windows found in homes per one hundred residents (from tax records)—presumably the greater number of openings in a house leads to more light and a healthier interior environment, and reflects higher incomes. The average in France at the time was 112 per 100 residents.
Educated as a barrister, Joseph Fletcher used his skills as a statistician to improve the health and well-being of his British compatriots. He was given several government appointments, including secretary of the children’s employment commission and inspector of state schools (1844), and his resulting statistical reports led to useful legislation in those areas. He was honorary secretary of the Statistical Society of London and editor of the Statistical Journal, and he published several treatises on education, which was one of his major interests.
Fletcher’s Summary of the Moral Statistics of England and Wales (London: privately printed, 1849?) compiles the tables and maps from his contributions to the Journal of the Statistical Society in 1847, 1848, and 1849. In his first paper about the subject, which he read before the Statistical Section of the British Association in June 1847, Fletcher saw an important role for the fledging science of statistics in an open society:
I wish to submit to the Section a few facts illustrative of the moral and intellectual condition of the English people. These facts form a very imperfect body of evidence; but gentlemen who are acquainted with the true nature of Statistics, or of science in general, will not therefore reject it, if it be the result of continuous and conscientious labour, applied to remove the frontier of doubt and ignorance which surrounds us but one step further back. Those who have expected our science to spring into existence ready armed like another Minerva, and complain that Statistics can know nothing because they do not know everything in the field of investigation which they propose to themselves, ask of us what they ask the labourers in no other department of inquiry. . . . It might rather be rejoined, that the more neglected are Statistics, the greater the reproach upon the age and the country in which their consequent imperfection is witnessed [Journal of the Statistical Society of London 10, no. 3 (September 1847): p. 193].
For his data, Fletcher drew from the latest census; income tax returns; reports of the registrar-general of births, deaths, and marriages; Home Office tables of criminal offenders; the latest reports of the Poor Law Commissioners; and a summary of savings banks published by the barrister who was appointed to certify their rules.
Reminiscent of A. M. Guerry’s work (1833) on the “moral statistics” of France [see his entry in this Sociology and Economics section], Fletcher provides twelve maps on similar subjects, such as ignorance, crime, poverty, and illegitimate births. Generally, he observes that
the figures here adduced bear conclusive evidence to the fact of the immediate alliance of all the moral evils of which we can yet obtain statistical cognizance with ignorance; and that this ignorance is the denser and more wide spread wherever there is the least active intervention of persons blessed with means, education, and a missionary spirit . . . [p. 29; Fletcher’s emphasis].
The conclusion is therefore irresistible that education is not only essential to the security of modern society, but that such education should be solid, useful, and above all, Christian . . . [p. 131; Fletcher’s emphasis].
Many of Fletcher’s views would still find resonance today, more than 150 years later.


[Above, left] “Dispersion of the Population in England and Wales 1841.” Lithograph map, 23.9 × 19.1 cm. Plate I from Fletcher’s Summary of the Moral Statistics of England and Wales (1849) [Historic Maps Collection].
Probably the earliest population density map of England. In seven shades, the map shows the proportion of inhabitants per one hundred acres that are below (lighter) or above (darker) the average of all of England and Wales. The forty-four counties are ranked (least dense to most), and their rank numbers are indicated on the map. As one would expect, the metropolitan/industrial areas of London, Liverpool, and Birmingham appear darkest.
[Above, right] “Improvident Marriages in England & Wales (Those of Males under 21, Being So Designated.) 1844.” Lithograph map, 23.9 × 18.9 cm. Plate IX from Fletcher’s Summary of the Moral Statistics of England and Wales (1849) [Historic Maps Collection].
In all of his maps, Fletcher associates darker tints with the “unfavourable end of the scale, whether of influence or results.” In this map, the counties are ranked from those having the lowest percentage of underage marriages to those having the highest, when compared with the average in all of England and Wales. Rutland (1), Middlesex (2), and Surrey (3) counties lead with the smallest proportions; Herts (42), Huntingdon (43), and Bedford (44) have the greatest. In attempting to explain these results in his text, Fletcher acknowledges that illegitimate births and underage marriages tend to run counter to each other; however, he believes that pauperism and ignorance are major influences in channeling youthful “incontinence.”
[Left] “Deposits in the Savings Banks in England & Wales in Proportion to the Population.” Lithograph map, 24 × 19.1 cm. Plate XII from Fletcher’s Summary of the Moral Statistics of England and Wales (1849) [Historic Maps Collection].
Essentially a map of prosperity, showing Wales to be near the bottom in terms of “persons of independent means” who maintain savings accounts. As that is essential, in Fletcher’s view, for the development and support of education, one would expect—and Fletcher’s statistics support—that these poorer counties rank near the top on his map of ignorance. He admits, though, that nothing is the result of one cause, and that the field of statistics is only beginning to identify the predominant moral influences.
Charles Joseph Minard, 1781–1870
Frenchman Charles Joseph Minard made most of his pioneering contributions to thematic mapping after a long career as a civil engineer. He worked on a number of canal and bridge projects in Europe, served as superintendent of the École Nationale des Ponts et Chaussées (National School of Bridges and Roads) from 1830 to 1836, and was inspector general of bridges when he retired in 1851. His most famous work, published in 1869, is “Carte figurative des pertes successives en hommes de l’Armée Française dans la campagne de Russie 1812–1813” [see below]. This flow map charts the disastrous campaign of Napoleon’s army in Russia, showing the movements of the troops and the huge losses of men against a scale of declining temperatures.
Prior to that chart, Minard had published a number of large lithographic maps that utilized innovative graphic designs to emphasize thematic concerns. In fact, American geographer and educator Arthur H. Robinson identified fifty-one separate thematic maps that Minard published from 1845 to 1869; most are very rare and exist only in the holdings of national institutions like the Bibliothèque Nationale de France and the archives of his government employer. Subjects covered include tonnage of cargo handled by large European ports (1856), tonnage of merchandise carried on the waterways and railroads of France (1859), coal distribution in England (1866), and European railroad passenger movements for 1862 (1865).
When the complete story of the development of thematic cartography during the nineteenth century is finally added to the annals of the history of cartography, the name of Charles Joseph Minard (1781–1870) will again take on some of the lustre it had during the latter part of his lifetime. . . . Minard was a pioneer in many respects, both in terms of his cartographic symbolism and in the handling of the data with which he worked [Robinson, Imago Mundi 21 (1967): 95].
Minard belonged to no major professional societies and published his maps privately—how and where they were distributed remains a mystery—yet his importance is clearly and widely recognized today.

Minard’s “Carte figurative des pertes successives en hommes de l’Armée Française dans la campagne de Russie 1812–1813” [map showing the successive losses in men of the French Army in the Russian campaign of 1812-1813]. Lithograph map, 30 × 62 cm [Wikipedia].
One of seventeen children, Henry Mayhew spent his early years on the sea. Back home by 1829, he tried his hand at freelancing as a journalist, writing a play, and managing a theater house. Deep in debt by 1835, he had to flee creditors and spent more than ten years in Paris, where he met and became friends with other English writers like William Makepeace Thackeray and Douglas William Jerrold.
In 1841, Mayhew cofounded Punch, a weekly magazine of humor and satire that became extremely popular (it closed in 1992). Mayhew used some of the same talented illustrators for his groundbreaking, influential London Labour and the London Poor. Comprised of articles he had written for the Morning Chronicle, the work initially appeared in three volumes in 1851; an expanded version in four volumes was published in 1861–1862. The work’s statistics-driven maps, combined with compelling graphics, provided unprecedented access into the lives of the Victorian poor. The appendix to volume 4 contains tabular data and fifteen associated maps “illustrating the criminal statistics of each of the counties of England and Wales in 1851.” Map subjects include the density of the population, intensity of criminality, intensity of ignorance, number of illegitimate children, number of early marriages (under age twenty-one), committals for rape, committals for bigamy, and criminality of females. Among the general population, ignorance was determined from marriage registers by tabulating the number of males and females who signed their names with marks.
Mayhew’s research was used by politicians and other writers advocating social reform. It is believed that novelist Charles Dickens was heavily influenced by Mayhew’s descriptions of London underclass life.
Portrait of Henry Mayhew. From vol. 1 (1861) of his London Labour and the London Poor: A Cyclopœdia of the Condition and Earnings of Those That Will Work, Those That Cannot Work, and Those That Will Not Work, 4 vols. (London: Griffin, Bohn, and Company, 1861–1862) [Graphic Arts Collection].


“Map Showing the Number of Persons Committed for Keeping Disorderly Houses [brothels] in Every 10,000,000 of the Population, in the Several Counties of England and Wales.” Lithograph map, 19.3 × 12 cm. From vol. 4 (1862) of Mayhew’s London Labour and the London Poor . . . [Graphic Arts Collection].
This map clearly shows/confirms that brothels (with implications for associated prostitution) are more prevalent in the country’s industrial areas and cities, including major ports.
[Above, left] “The Crippled Street Bird-Seller.” From vol. 2 (1861) of Mayhew’s London Labour and the London Poor . . . [Graphic Arts Collection].
What was unique about Mayhew’s work was the breadth and depth of his firsthand accounts:
It surely may be considered curious as being the first attempt to publish the history of a people, from the lips of the people themselves—giving a literal description of their labour, their earnings, their trials, and their sufferings, in their own “unvarnished” language; and to pourtray the condition of their homes and their families by personal observation of the places, and direct communion with the individuals. . . . Within the last two years some thousands of the humbler classes of society must have been seen and visited with the especial view of noticing their condition and learning their histories . . . [vol. 1, p. iii].
The index to each volume reads like a vaudevillian “who’s who” of London street life and employment options of the poor: ballast-getters, beetle-destroyers, bone grubbers, chalker on flag-stones, cigar-end finders, dog-collar seller, dustmen, glee-singers, penny mouse-trap maker, punchmen, rag gatherers, stilt vaulters, street poets and authors, water-cress girl. According to Mayhew, “there are about 40,000 people engaged in selling articles in the streets of London” [vol. 2, p. 97].
[Above, right] “A View in Rosemary-Lane.” From vol. 2 (1861) of Mayhew’s London Labour and the London Poor . . . [Graphic Arts Collection].
One side of the lane is covered with old boots and shoes; old clothes, both men’s, women’s, and children’s; new lace for edgings, and a variety of cheap prints and muslins . . . . Some of the wares are spread on the ground on wrappers, or pieces of matting or carpet . . . . And amidst all this motley display the buyers and sellers smoke, and shout, and doze, and bargain, and wrangle, and eat and drink tea and coffee, and sometimes beer [vol. 2, p. 40].