
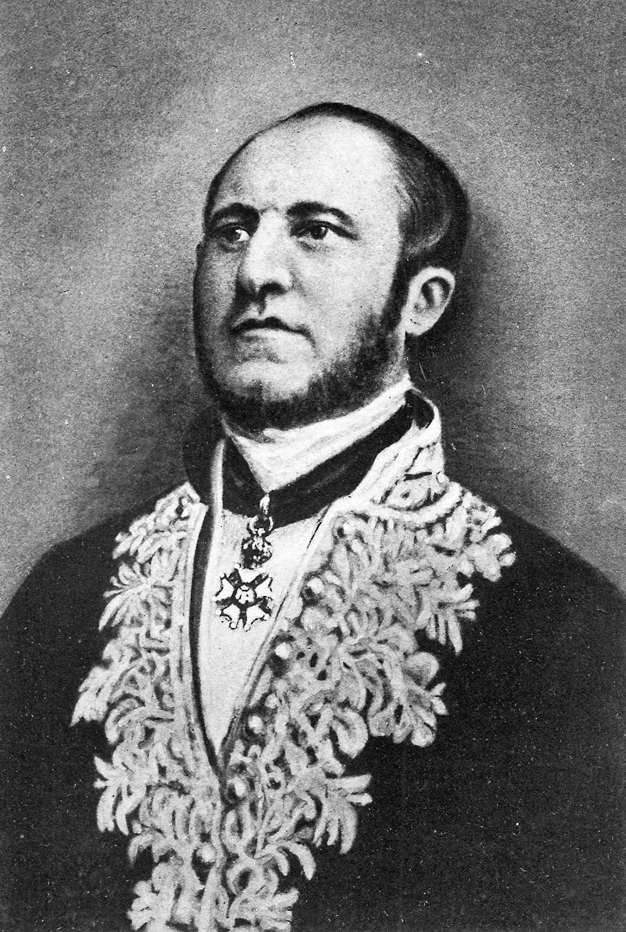
Portrait of James Cowles Prichard, 1786–1848. From D. J. Cunningham’s “Anniversary Address,” Journal of the Royal Anthropological Institute of Great Britain and Ireland 38 (January–June 1908): 10–35 [General Library Collection].
Trained as a physician, Englishman James Cowles Prichard is considered a precursor of Charles Darwin and a founder of racial studies. He was one of the first ethnologists to believe that all races originated from the same species in Africa. In medicine, he specialized in nervous system disorders—what we call psychiatry—and was the first to define senile dementia
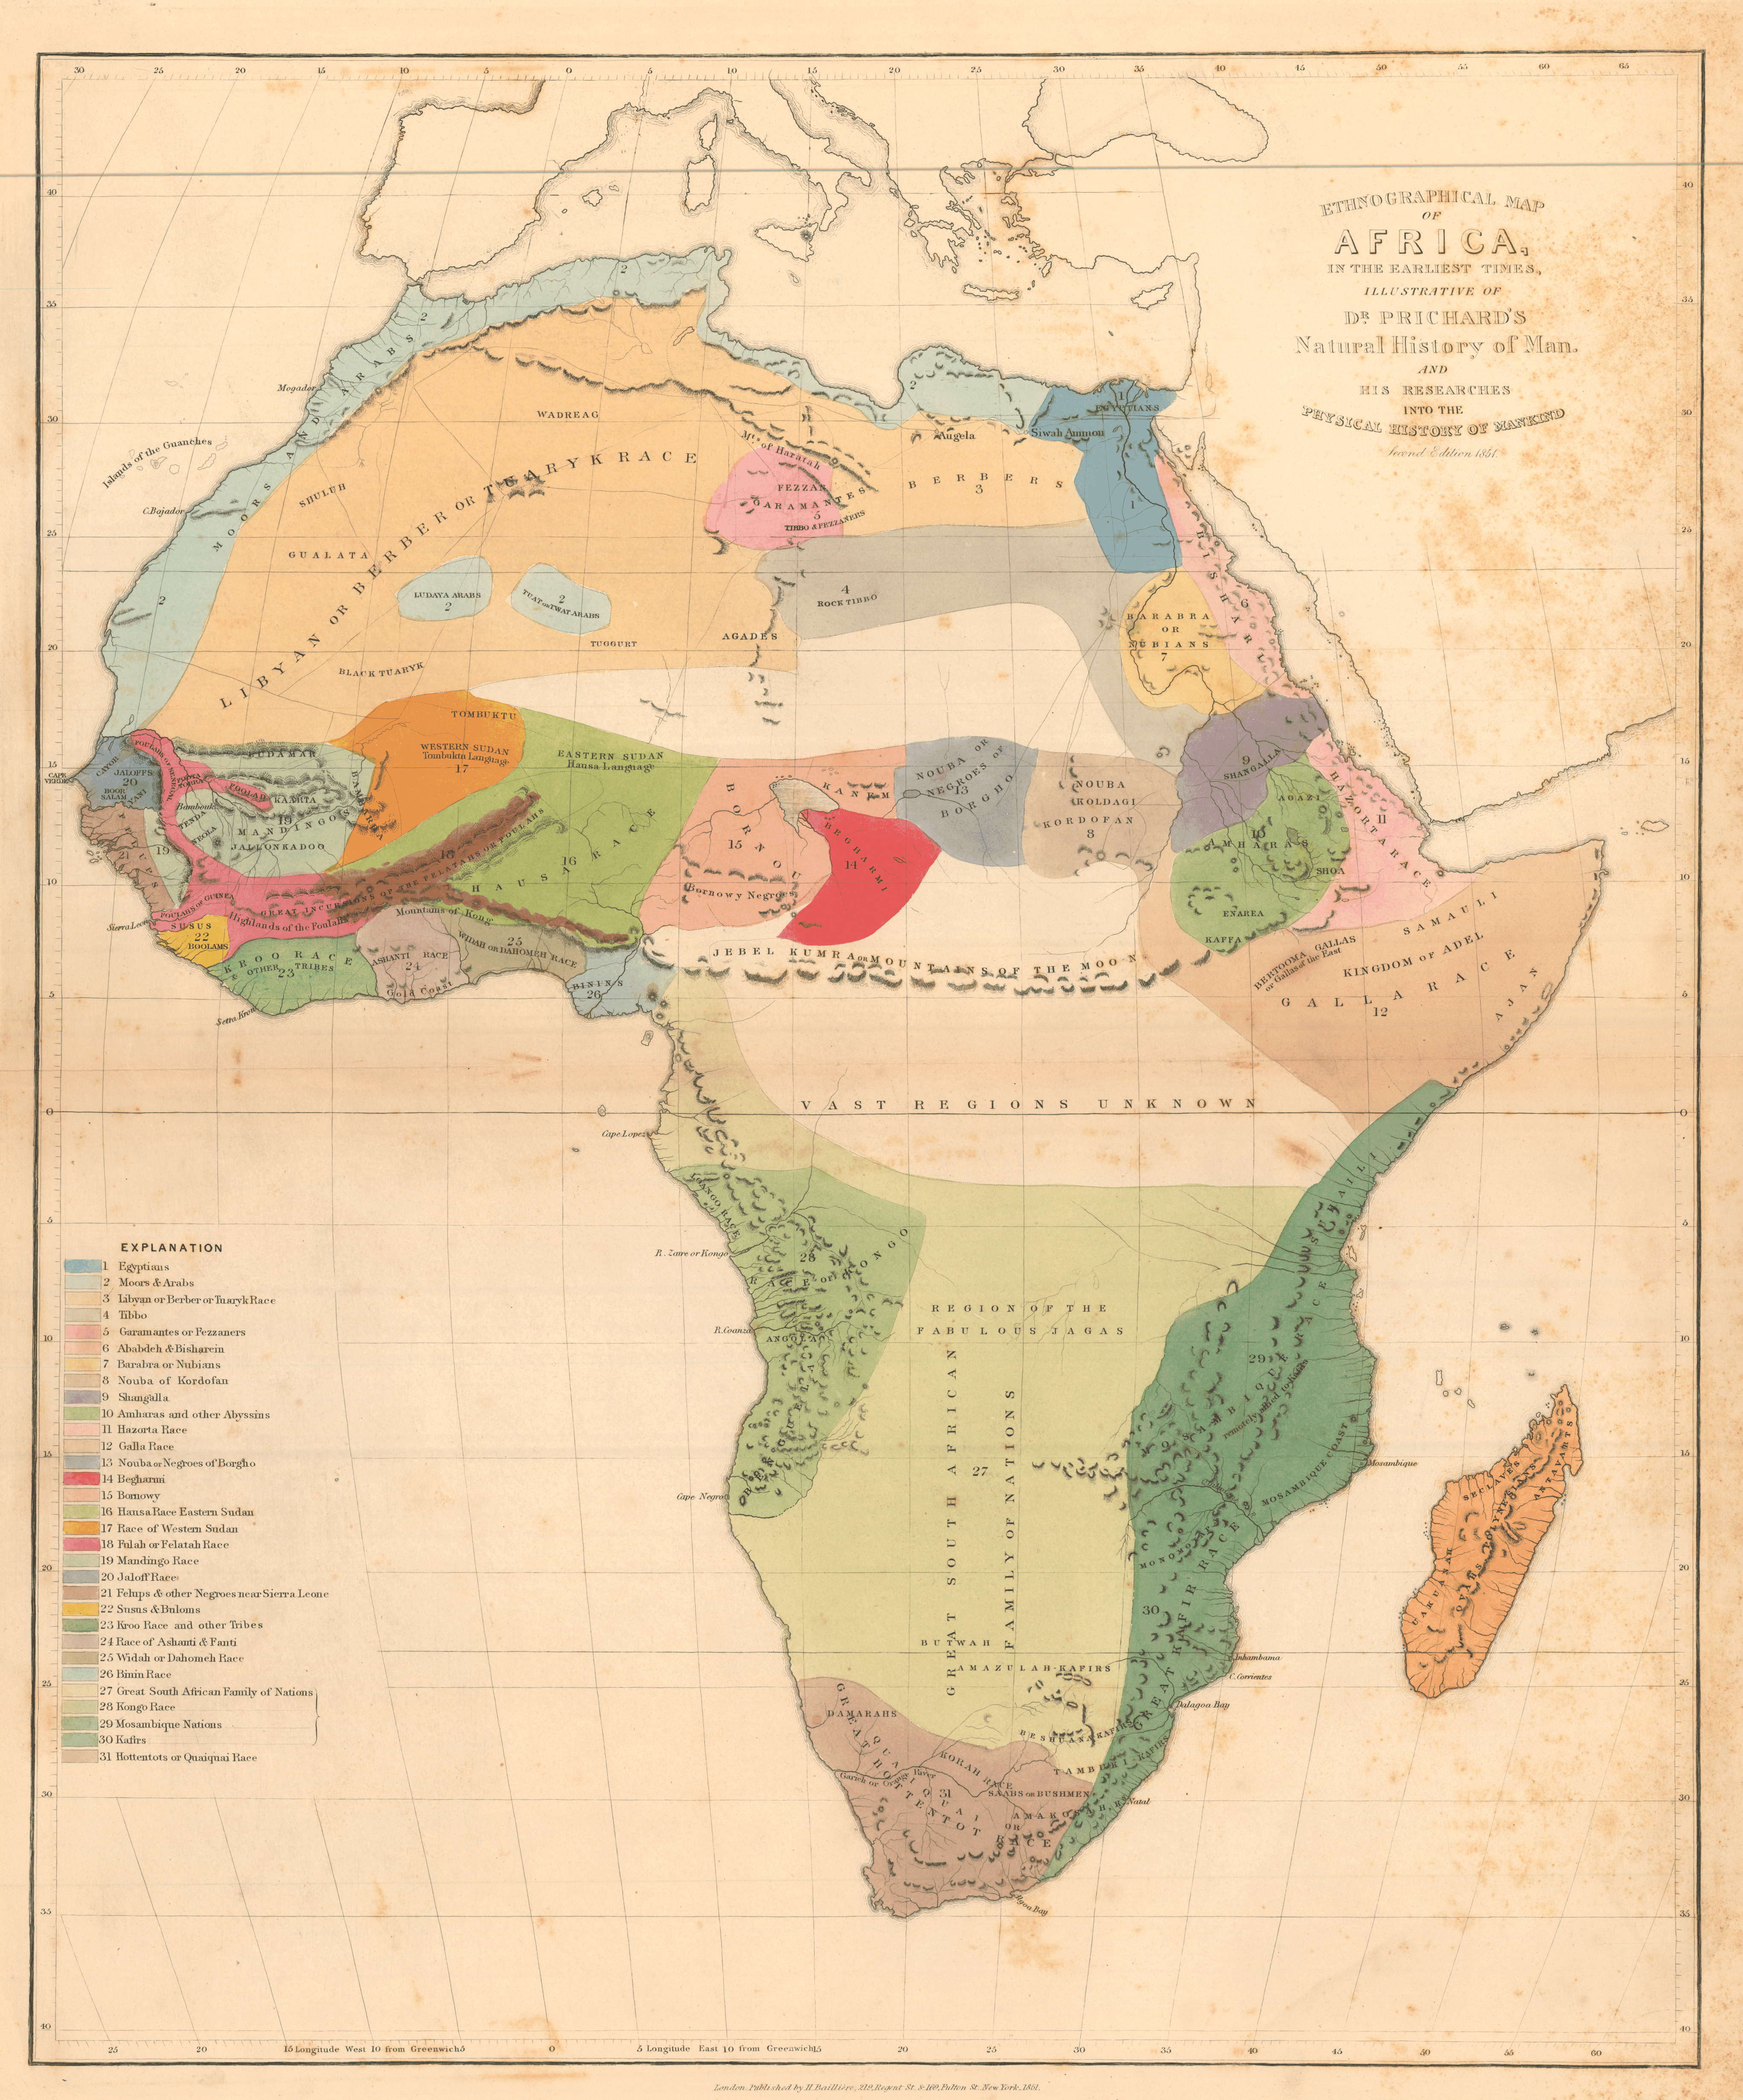
"Ethnographical Map of Africa, from the Earliest Times, Illustrative of Dr. Prichard’s Natural History of Man and His Researches into the Physical History of Man.” Engraved map, with added color, 58.3 × 48 cm. From Pritchard’s Six Ethnographical Maps . . . , 2nd ed. (London, New York: H. Baillière, 1851) [Historic Maps Collection].
Prichard’s set of ethnographical maps, originally published in 1843, was the first of its kind. In his cover note, he recognizes that “it is impossible to represent in one map the positions of nations in periods of time very distant from each other. These positions vary through the effect of migrations and conquests” [p. 1]. Hence, some anachronism results. In respect to his Africa map, Pritchard admits that much of the representation of the interior is conjectural; divisions of regions and countries is based on authorities. The color key identifies thirty-one different races.
Gustaf Kombst. “Ethnographic Map of Europe.” Engraved map, with added color, 46.9 × 56.8 cm. From Alexander Keith Johnston’s The National Atlas of Historical, Commercial, and Political Geography: Constructed from the Most Recent and Authentic Sources . . . Accompanied by Maps and Illustrations of the Physical Geography of the Globe by Heinrich Berghaus, and an Ethnographic Map of Europe by Gustaf Kombst (Edinburgh: J. Johnstone; W. & A. K. Johnston . . . , 1846) [Rare Books Division]. The first edition of the atlas appeared in 1843, the same year as Pritchard’s publication. The five maps of physical geography (four by Berghaus and this one by Kombst) are thought to constitute the beginning of Johnston’s landmark thematic atlas of 1848 [see his section in the Landmark Thematic Atlases section].
Kombst accompanies his map with four lengthy pages of descriptive notes. Though they are dated March 1844 in this edition, the map first appeared as a separate publication in 1841. He begins by talking generally about the utility of such mapping:
An Ethnographic Map would be of great use in History and Statistics, but of still greater use in the Natural History of Man. . . . Circumstances have so far favoured the projector of this Map, as to enable him to see the three great varieties of the so called Caucasian species in Europe, viz., the Celtic, Teutonic, and Sclavonian, in several countries inhabited by them. He has devoted to the subject of the physical differences of these varieties, their origin, connection, &c., undiminished attention for a great number of years. Yet, as this is the first Ethnographic Map ever published, based upon the principle of the natural physical difference of the different varieties of the Caucasian species inhabiting Europe, he is fully aware, that it must in many respects still remain deficient. . . . But a beginning must be made, and in this matter, as in many others, it requires the co-operation of a great number of minds, and a long series of observations by each, to arrive at complete scientific correctness, at which stage such studies may turn out to be highly useful in many more points than can at present be anticipated [p. 53; my italics].
Clearly, he is an advocate of the Baconian approach to the acquisition of knowledge. Among possible benefits of such ethnographic study, according to Kombst, is information on the intellectual and moral character of nations, their languages, and forms of government. One interesting conclusion he has drawn so far is that nations are so differently constituted that no one form of government can be applicable, at the same time, to all of them. (Something for U.S. foreign policymakers to ponder?)
The map’s coloring is purposeful. For the three main Caucasian species, Kombst uses blue for Celtic, yellow for Teutonic, and red for Sclavonion. To indicate a crossing of these varieties, he has mixed the colors in such a manner that the dominant color in the mixture indicates the dominant national element—more blue, more Celtic, for example.

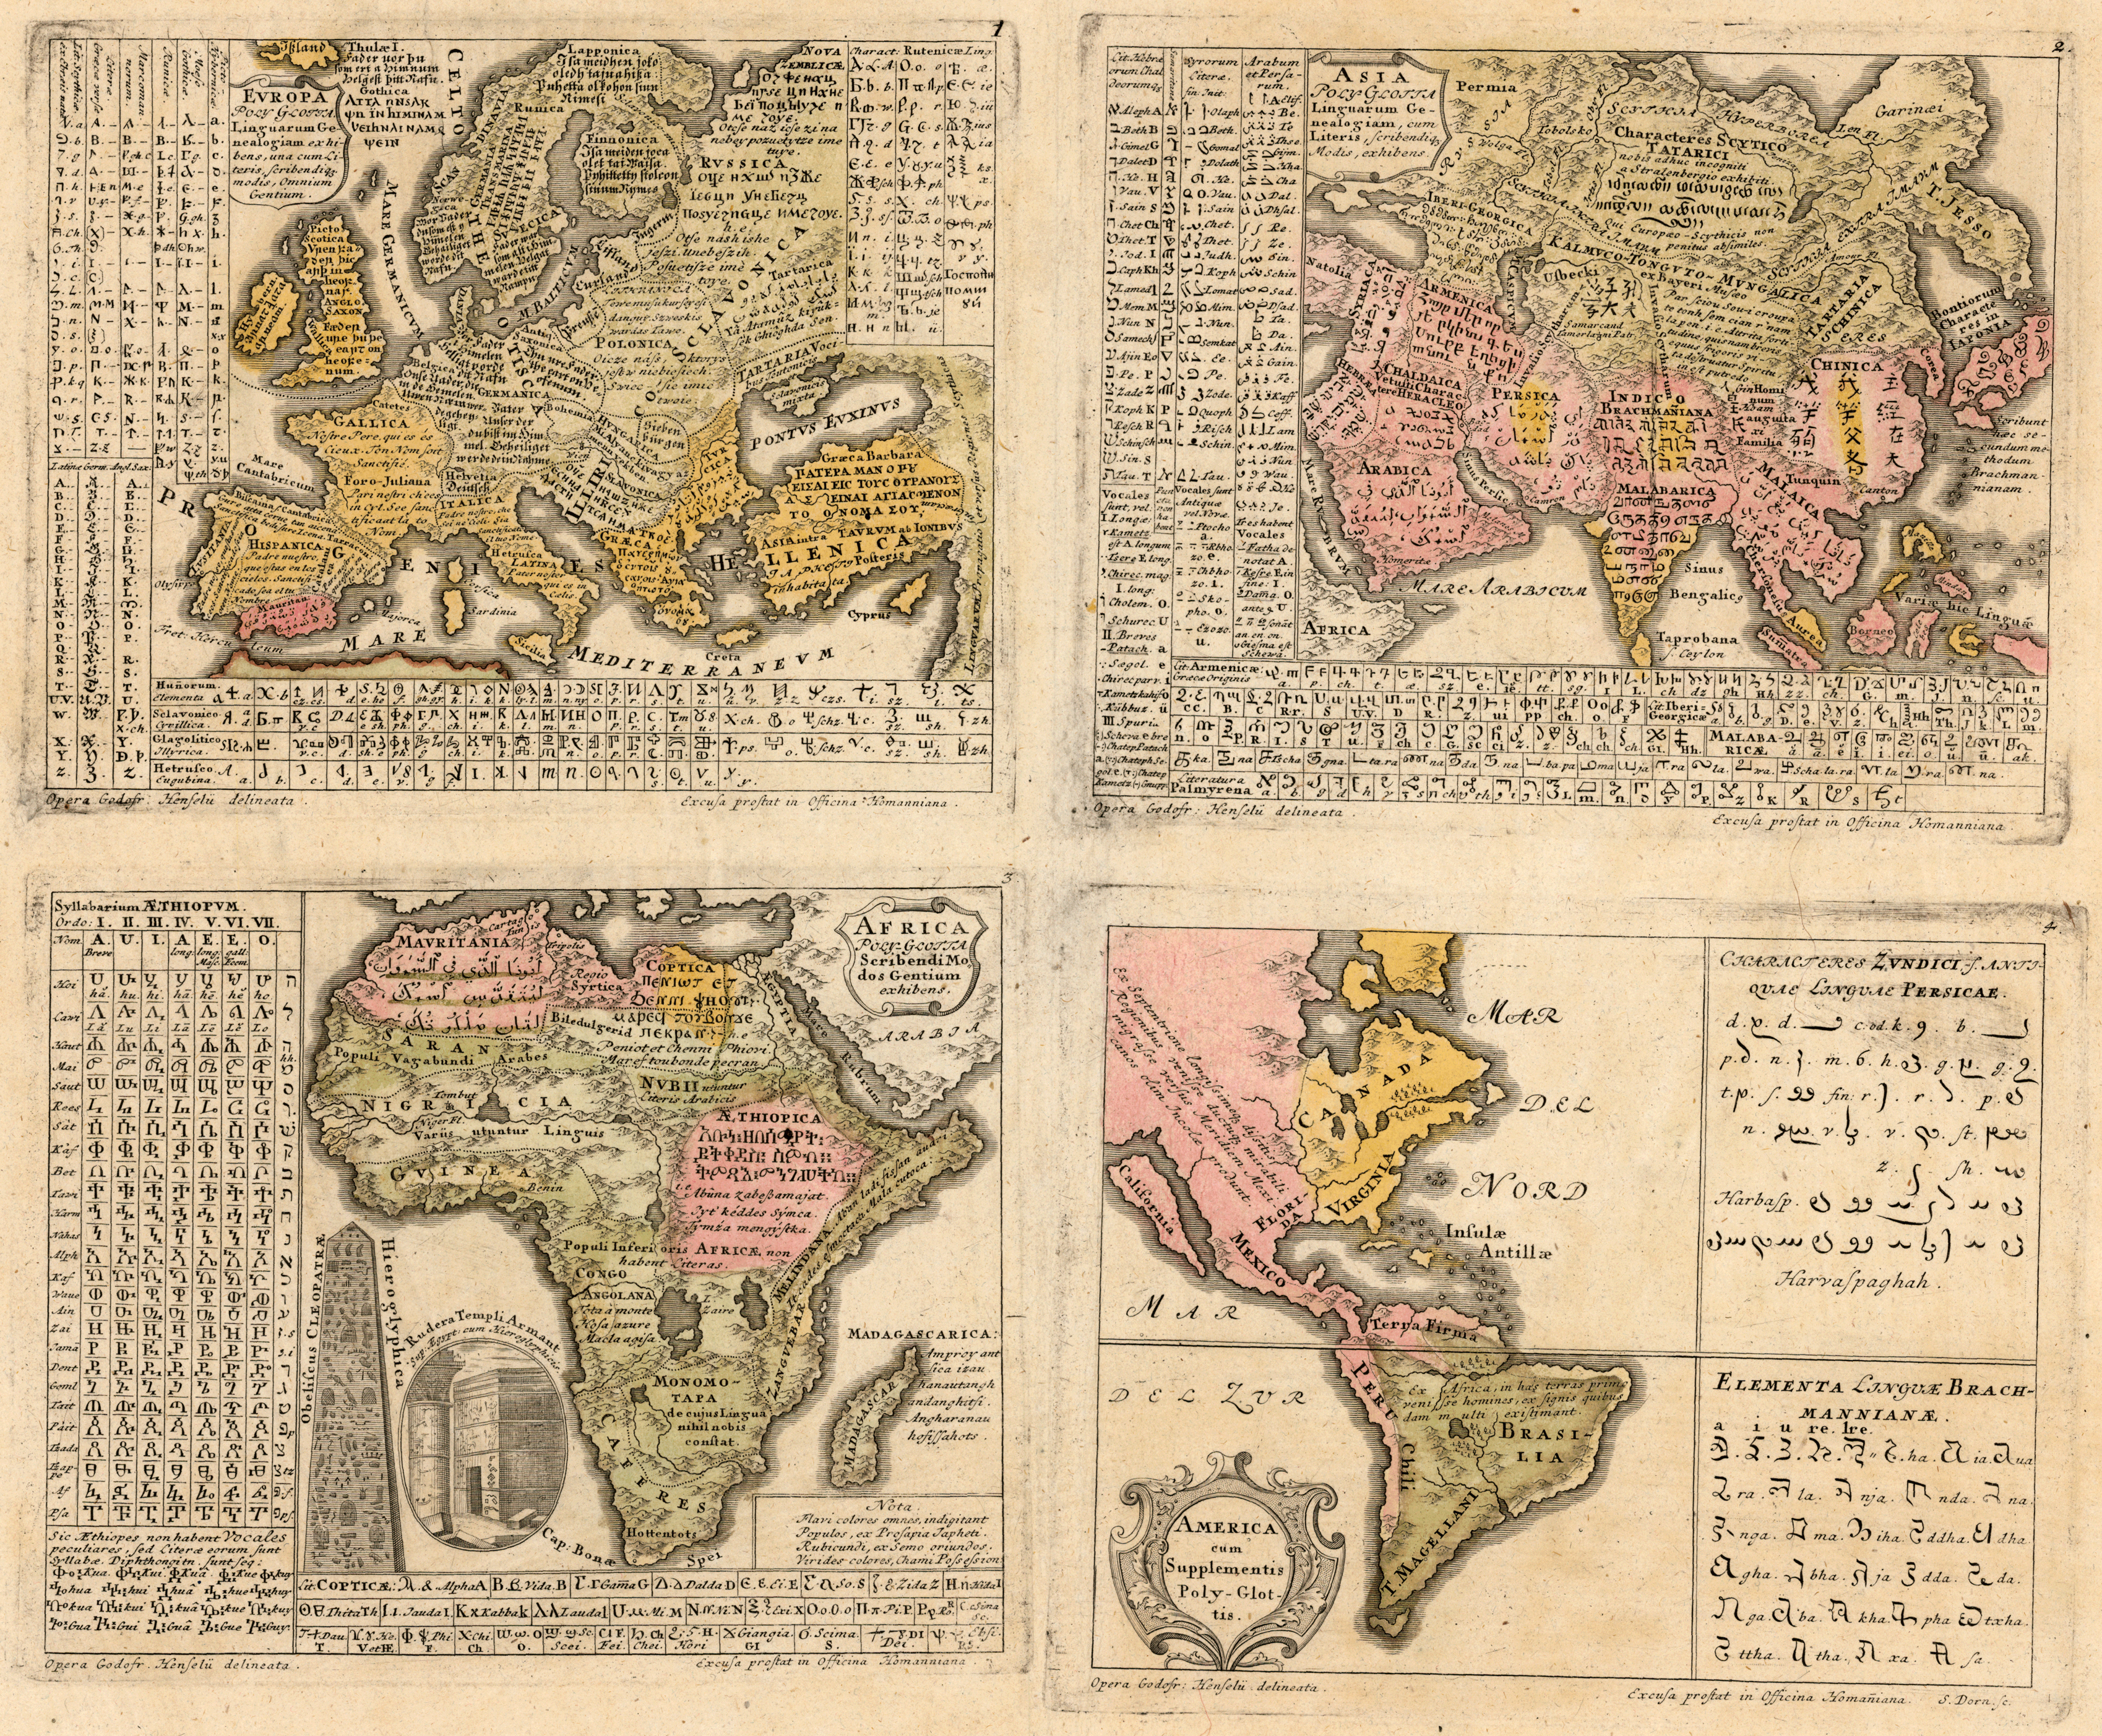
Gottfried Hensel, b. 1689? “Europa poly glotta: Linguarum genealogiam exhibens, una cum literis, scribendiq[ue] modis, omnium gentium” ([Nuremberg]: Excusa prostat in Officina Homanniana, [1741]). Four copperplate maps, with added color, each 16 × 21 cm, on one sheet 51 × 57 cm [Historic Maps Collection]. From his Synopsis vniversae philologiae . . . (Nuremberg: Homann, 1741).
The earliest linguistic maps of the four continents. Where he can, Hensel translates the first few words of the Lord’s Prayer (“Our Father, who art in Heaven, hallowed be thy name”) into local languages. Elsewhere, as in America and Africa, he notes human migrations. In Brazil, for example, evidence suggests, he says, that the first humans there came from Africa. In the box at the bottom right of Africa, he states that the map colors mark areas settled by descendants of the three sons of Noah: Japhet (“rubicundi,” here pink), Shem (“oriundos,” here yellow-orange), and Ham (“virides,” here olive green). Along the sides and at the bottom of the four maps are alphabet tables that cover most known written languages.

Portrait of John Speed (1552?–1629), by Solomon Savery [Graphic Arts Collection].
Military History
John Speed came into mapmaking late in life, having worked in his father’s tailoring business until he was about fifty. An interest in history brought him in contact with Sir Fulke Greville, who offered financial support, and Queen Elizabeth I, who allowed him working space in the Custom House. His 1611/1612 atlas, The Theatre of the Empire of Great Britaine, was the first comprehensive English atlas, and it contained the first set of English county maps, most with town plans; these probably constitute his most significant contributions to English cartography.
[Below] "The Invasions of England and Ireland: With Al Their Ciuill Wars since the Conquest." Copperplate map, 38 x 51 cm [Historic Maps Collection]. From Speed's A Prospect of the Most Famous Parts of the World (London: Printed for Thomas Basset . . . and Richard Chiswel . . . , 1676). Published as a complement to Speed's earlier work, A Prospect was the first world atlas published by an Englishman; the first edition appeared in 1627.
This map covers the period from the Norman Invasion of 1066 through the Spanish Armada of 1588, but its focus is on battles fought among Britons. The sites of the battles are marked with small banners containing a place name and number. (Several pages of text in the atlas, keyed to the numbers, identify the combatants and summarize the action.) Most of the battles feature miniature groups of pikemen facing each other, forming a canopy with their tall weapons; several show cavalry engagements. The ships of the Spanish Armada take center stage at the bottom. In Ireland, there are two, more descriptive, scenes: "Oneal kild by the wild Scots" (1567) and “Desmond beheded” (1468). In all, more than eighty-five military encounters are noted on the map.

Appointed préfet de la Seine (head of the city’s administration) by Napoleon III in 1853, Baron Haussmann is associated with the rebuilding and modernizing of Paris. Among his many changes/improvements to the city’s landscape were wide boulevards radiating from the Arc de Triomphe, expansive gardens, new bridges, a new water supply, and a huge new sewer system. His transformations affected more than 50 percent of the city’s area. Historically, he has either been hated as the man who destroyed medieval Paris or loved as the one who created the modern metropolis we know today.
[Below] Segment “Nord-Est, 1861” of Haussmann’s “Carte statistique des égouts, dressée sur la demande du conseil municipal par M. l’ingénieur en chef Emmery, continuée par ses successeurs, étendue jusqu’aux fortifications, par ordre de Mr. le Baron G. E. Haussmann . . . 1861” (Paris: imp. lith de V. Janson, [1861]) [Historic Maps Collection]. Lithograph map in four segments, with added color, each segment dissected in fifteen pieces, mounted on cloth, 150 × 190 cm.
Certainly not the first sewer map of Paris, but the largest (roughly 5 feet × 6 feet) and most detailed of its time, indicative of the scope and scale of Haussmann’s massive undertaking. Under his watch, the sewer system was quintupled, and tunnel sizes were greatly enlarged and standardized. Note the outer, numbered sections of the fortifications, which mark the boundaries of the city proper. [Compare with H. N. Maire’s administrative maps of Paris in his Landmark Thematic Atlases section.]
Portrait of Georges Eugène Haussmann (1809–1881) in 1853. From vol. 2 of his Mémoires du baron Haussmann . . . (Paris: Victor-Havard, 1890–1893) [General Library Collection].
