Medicine
Early “medical” maps lacked precise data, but their creators’ impulses were definitely Hippocratic. Topographies of disease started to appear regularly in the 1830s and 1840s, as epidemics lent themselves well to cartographic expression. Cholera, the first truly global disease, was a major focus of these early maps. Ultimately, they played a decisive role in identifying the source of the scourge.
Giovanni Maria Lancisi, 1654–1720
Giovanni Maria Lancisi was an Italian physician and anatomist, trained at the Pontificia Università Gregoriana and Università di Roma in Rome. He was physician to Popes Innocent XI, Clement XI, and Innocent XII.
[Below] Untitled copperplate map ("pag 154"), 18.2 × 37.2 cm. From Lancisi's De noxiis paludum effluviis, eorumque remediis: Libri duo [On the noxious effluvia of marshes and their remedies] (Rome: Typis Jo. Mariae Salvioni . . . , 1717) [Rare Books Division].
In this important work, Lancisi argues that mosquito-infested swamps are the breeding ground for malaria and recommends draining them to prevent it. He believes that trees have important ecological value, and he deplores the destruction of forests. His map of the area between the gulfs of Astura and Terracina, south-southeast from Rome (shown in the upper left), identifies twenty-six forested quarters ("quarti delle selve") and four ruined lands ("terre dirute"). The directions of the major winds are also given. The Roman statesman and orator Cicero had owned a villa in the area.

Portrait of Giovanni Maria Lancisi. Frontispiece to his De motu cordis et aneurysmatibus opus postumum . . . (Neapoli: Felix-Carolus Musca, 1738).
>
Son of a successful New York City merchant, Valentine Seaman resisted the pressure to join his father in business and, instead, followed his heart into medicine. He began his medical studies under the care of Dr. Nicholas Romayne (born “Romeyn”), a dynamic New York medical figure who is considered today one of the founders of Columbia University’s College of Physicians and Surgeons—then furthered his training at the city’s almshouse. In 1791, Seaman went to the University of Pennsylvania in Philadelphia to study under Benjamin Rush, Adam Kuhn, and others; he graduated with his M.D. the following year. He made his home in New York on Beekman Street, opposite the Old Brick Church, where he and his wife had ten children.
After he lost his first child to smallpox in 1795, Seaman obtained serum from English doctor Edward Jenner, who had made great inroads against the disease by inoculating subjects with fluid taken from cowpox lesions. Seaman used it successfully first on his son and then others, and thus he is credited with introducing the practice to New York. He was also instrumental in improving the art of midwifery by offering formal classes to women and writing The Midwives Monitor (1800), the first instruction manual on midwifery published in the United States. Seaman belonged to the Society of Friends, for which slavery was anathema, and he became an active member of the New York Manumission Society, which sought the liberation and well-being of slaves. When he died of tuberculosis at the age of forty-seven, Seaman left behind a progressive public health legacy.

Portrait of Valentine Seaman. Photograph of oil painting by Lewis T. Ives [courtesy of Larry McCurdy].


[Above] Plate I and Plate II from Seaman’s “An Inquiry into the Cause of the Prevalence of the Yellow Fever in New-York,” dated March 10, 1797. Medical Repository, 1 (1800, 2nd edition): 303-323 [Rare Books Collection].
Describing recent fatal cases of yellow fever and plotting the addresses of the victims on these plates, Seaman concludes his review with several observations about the disease. His main point, emphasized in italics, is “that no Yellow Fever can spread, but by the influence of putrid effluvia” [p. 322]. In the case of the first plate, a sewer drain empties at the end of Roosevelt Street; in the second, the slips on each side of the end of Pine Street are filled with “rubbish and filth of every description.” Both areas are low-lying and so often contain stagnant, putrid water. Eliminating “these pools of putrefaction” would help safeguard residents against the disease. Cartographically, Seaman notes that he lacks the symbols to adequately locate all the other cases, for the result would be “objectionable” [p. 309]—that is, probably too dense to be intelligible. The mapmaker’s technique could not match the physician’s thematic need.

Portrait of Amariah Brigham. Engraved by H. B. Hall from a daguerreotype. From “Images from the History of Medicine,” National Library of Medicine, Bethesda, Md.
An American physician and asylum superintendent, Amariah Brigham was one of the founders of the Association of Medical Superintendents of American Institutions for the Insane (1844), which became the American Psychiatric Association, and he was the first editor of the American Journal of Insanity (now known as the American Journal of Psychiatry). In 1835, he published Observations on the Influence of Religion upon the Health and Physical Welfare of Mankind, in which he argued that the misuse of religion, particularly the emotional pitch aroused by evangelists in their protracted meetings, was harmful to the nervous system. Brigham was influential in advocating for the institutionalization of the mentally ill (rescuing them from jails and poor houses), implementing active treatment plans, and educating the public about its responsibility for such dependent people. His moral therapy included individual attention in a familylike setting that offered educational, occupational, recreational, and religious programs.

[Above] “Chart Showing the Progress of the Spasmodic Cholera.” Engraved map, with outline color, 24 × 43 cm. Frontispiece to Brigham’s A Treatise on Epidemic Cholera: Including an Historical Account of Its Origin and Progress, to the Present Period (Hartford, Conn.: Huntington, 1832) [Historic Maps Collection].
One of the first world charts of a disease. The map traces the spread of cholera from two main sources, India (1817) and China (1820), across Asia and the Middle East via trade routes, to France and England in 1832—and thence to North America. More of a compendium, drawing on numerous reports and other publications, than a product of personal experience, Brigham’s study functions on several levels by providing the historical context of the disease, describing the medical community’s current understanding of its operation, and summarizing the latest, best advice for preventing it. According to Brigham’s literature research, positive spirits (no fear); ventilation; avoidance of chills (dress warmly); exercise; cleanliness; a diet of well-cooked meats, fresh vegetables, and fruit; and sobriety—all habits commonly associated with good health—are anticholeric.

Portrait of Edwin Chadwick. From Maurice Marston’s Sir Edwin Chadwick, 1800–1890 (London: Parsons, [1925]) [General Library Collection].
Edwin Chadwick is remembered as a British social reformer whose most lasting legacy is in the improvement of sanitary conditions and public health. Ironically, as secretary to social theorist Jeremy Bentham, Chadwick earlier had authored the Royal Commission’s report behind the British Poor Law Amendment Act (1834), which created public workhouses where working conditions were notably vile. Their purpose was to get the lazy, shiftless poor to perform socially profitable work; however, he soon learned that sickness prevented many of the poor from working, not their lack of desire or bad work habits. Logically, he argued that it would be less expensive to promote and create a healthier environment for workers. Hence, his motivation was not primarily humanitarian but, rather, more economic. In his research, Chadwick was one of the first to correlate class/income and population density with the incidence of disease. From 1848 to 1849, he was commissioner of the Metropolitan Commission of Sewers in London and, from 1848 to 1854, commissioner of the General Board of Health. He tried unsuccessfully to get house drains hooked up to public sewers; more epidemics followed. He retired in 1854 but continued to volunteer his time on sanitation matters. In recognition of his public service, Chadwick was knighted in 1889.


[Above] “Sanitary Map of the Town of Leeds.” Lithograph map, 17.3 × 37.8 cm. “Map of Bethnal Green Parish. . . .” Lithograph map, 31.5 × 40.5 cm. Both from Chadwick’s “Report on the Sanitary Conditions of the Labouring Population of Great Britain,” published in the Poor Law Commissioners’ Report to Her Majesty’s Principal Secretary of State for the Home Department, from the Poor Law Commissioners, on an Inquiry into the Sanitary Condition of the Labouring Population of Great Britain, with Appendices (London: W. Clowes and Sons, 1842) [Historic Maps Collection]. Chadwick’s 457-page report constitutes the entire Poor Law Commissioners’ report.
In the Leeds map, Chadwick identifies two groups of dwellings: houses of the working class and “shops, workhouses, and houses of tradespeople.” Dots (blue for cholera and orange for other contagious diseases) proliferate in the working-class areas. Note that these are not contiguous regions but are sprinkled around the map.
The Bethnal Green map shows deaths (+) in the parish for 1838, caused by four classes of disease—contagious/epidemic diseases, diseases of the brain and nerves, diseases of the lungs, diseases of the digestive organs. What is interesting about this landmark map is that Chadwick distinguishes between the houses occupied by weavers/laborers and tradesmen/shopkeepers; in other words, he relates classes of housing to disease. From the map, it is clear that many more deaths occurred in the crowded, poor homes of the laborers, a conclusion that led Chadwick to closely examine housing conditions.
In fact, Chadwick found that prison conditions often were healthier (in terms of general cleanliness, ventilation, and water) than those he found among the working populations living in cellars in Liverpool, Manchester, and Leeds. Much of his report is devoted to recommending better layouts in the construction of cottages and living quarters for the working class. Overall, he concludes that
. . . the public loss from the premature deaths of the heads of families is greater than can be represented by an enumeration of the pecuniary burdens consequent upon their sickness or death. . . . The primary and most important measures [for improving health], and at the same time the most practicable, and within the recognized province of public administration, are drainage, the removal of all refuse of habitations, streets, and roads, and the improvement of the supplies of water [pp. 369–370].
Portrait of Thomas Shapter in the Royal Devon and Exeter Hospital, by an unknown painter. From the Wellcome Gallery (London).
A graduate of Edinburgh University, Thomas Shapter spent most of his medical career in Exeter, England, where he arrived in 1832, the year of a great cholera epidemic. His subsequent, detailed study of that disease, with its important map, made his reputation. The British Parliament’s Cholera Prevention Act of 1832, following upon the creation of local boards of health, enabled communities like Exeter to benefit from better collection of data relating to that disease. By the time Shapter began his book about that year’s outbreak, however, many of those health reports had been lost, thus requiring him to make an exhaustive effort to unearth every relevant document and to interview survivors. He explains in the preface to The History of the Cholera in Exeter in 1832 that the map
which forms the frontispiece, has been constructed with great care and attention to particulars, and at the expense of much labour; for I have not only consulted the official returns, the registers of deaths, and the registers of burials, but personally and diligently sought information from those engaged in the burials themselves . . . [p. ix].
Shapter’s volume was embellished with thirty woodcuts of Exeter scenes by his artist friend John Gendall. A curious subject of one of the book’s chapters is the efficacy of flannel belts, worn around the waist, in protecting people against the disease. According to Shapter, the Exeter Board of Health resolved in the fall of 1831 to give such articles of clothing to poor people, and 7,440 were distributed. Shapter thought the idea was useless and a waste of money, but he recorded the incident anyway in his role as historian of the Exeter epidemic.
The visual power of Shapter’s map may have influenced John Snow [see the John Snow entry in this Medicine section] to include a map in the second edition (1854) of his famous study of cholera in London, for the first edition (1849) had contained only tabular data.
“Map of Exeter in 1832 Shewing the Localities Where the Deaths Caused by Pestilential Cholera Occurred in the Years 1832, 1833 & 1834.” Lithograph map, 16.6 × 19.5 cm. Frontispiece to Shapter’s The History of the Cholera in Exeter in 1832 (London: John Churchill . . . ; Exeter: Adam Holden . . . , 1849) [Historic Maps Collection].
Using red horizontal bars (1832), red diamonds (1833), and red dots (1834). Shapter locates the individual cholera deaths of those years. Numbered in the top map key are sites identified with the city’s response to the epidemic, such as places where contaminated clothes were burned and buried, convalescent homes, druggists, burying grounds (see far upper right corner of the map, for example), and soup kitchens. In the other legend box, the parishes of Exeter are listed by the percentage of their populations affected by the disease, and each is assigned an alphabetic letter on the map. For Shapter, the evidence in the map was irrefutable: cholera was rampant in low-lying areas of dense habitation, near the river, where drainage was poor and waste and refuse accumulated—in others words, the disease was miasmatic.


“Zu Rothenburg’s Cholera-Epidemie des Jahres 1832 in Hamburg.” Lithograph map, with added color, 27.7 × 43.6 cm. From J.N.C. Rothenburg’s Die Cholera-Epidemie des Jahres 1832 in Hamburg: Ein Vortrag, gehalten im der wissenschaftlichen Versammlung des ärztlichen Vereins, am 17 November 1835 (Hamburg: Perthes & Besser, 1836) [Historic Maps Collection].
Another mapping of cholera in 1832, on a coarser scale, was made in Hamburg, Germany, by Dr. Rothenburg, using hand-colored gradations of red—via the chloropleth method—to show the relative, aggregate incidence of the disease. It was reprinted in an 1850 British parliamentary report on cholera, emphasizing the international appeal of this cartography.

“Cholera Consultation / The Central Board of Health” ([London:] S. Knights, Feby. 27th. 1832). Lithograph print by George Cruikshank, with added color, 20 × 32.5 cm [Graphic Arts Collection].
In the midst of the 1832 cholera epidemic, British caricaturist and book illustrator Cruikshank pulls no punches in lampooning fat, self-serving doctors charged with the care of public health:
“While Drs. defer & deny—
The country bleeds & patients die.”
The oldest of nine children born to a poor York coal yard worker, John Snow became a pioneer in the use of anesthesia, and he is recognized today as one of the founders of epidemiology. Family connections earned him an apprenticeship with a surgeon/physician at age fourteen. Subsequently, he worked at various locations as a medical and apothecary assistant and then went to the Hunterian School of Medicine in London; in 1837, he worked at Westminster Hospital and later set up his own private practice in the Soho area of London. In 1844, he graduated from the University of London and was admitted to the Royal College of Physicians in 1850.
In the 1840s, Snow progressed from practicing general medicine to publishing his medical research and becoming a specialist in anesthesia, which had first been demonstrated in London in 1846. His clinical textbook on the subject, On the Inhalation of the Vapour of Ether in Surgical Operations (1847), secured his reputation as a leading practitioner of the science. Later, he administered chloroform to Queen Victoria when she gave birth to her last two children, Leopold (1853) and Beatrice (1857).
During this period cholera returned to England (1849 and 1854) and was particularly virulent in the Soho area where Snow lived. He began to concentrate his attention and research on the disease and its causes, developing a theory that ran counter to the prevailing view that miasmatic, foul airs carried the disease from urban refuse. Snow believed the disease was water-borne and spread from individual to individual. The Thames River was the city’s primary source of drinking water and also its principal sewer. In a large-scale South London study, Snow showed that water supplied by the Southwark and Vauxhall Company, compared with that from the Lambeth Company or other sources, was associated with ten times more cholera deaths. Southwark and Vauxhall drew from sources Snow believed were polluted by the city’s waste; Lambeth used sources farther from the city.

Portrait of John Snow in 1857. Frontispiece to his Snow on Cholera, Being a Reprint of Two Papers by John Snow, M.D. . . . (New York: The Commonwealth Fund, 1936) [Rare Books Division].
But it was Snow’s other, focused study on the Broad Street neighborhood of Soho that made him famous. Here, he began with a thesis, collected data, and used a map to confirm his argument. Snow personally investigated hundreds of cholera deaths (of all classes), seeking the sources of the household water used by the decedents; he mapped more than five hundred cases. The results conclusively led him to a water pump on Broad Street. The handle to the pump was removed, and the intensity of the cholera outbreak declined. The “cholera poison,” Snow believed, was cell-like, reproduced quickly, and was invisible to the eye. However, not everyone who had drawn water from that source became infected. Also, miasmatic theorists believed that Snow’s evidence did not necessarily undermine their position, for some kind of localized outbreak would be expected from a noxious miasma.
The debate over the cause of cholera continued well after Snow’s death from the effects of a stroke in 1854. Coincidentally, in the same year, the Italian anatomist Filippo Pacini isolated the microscopic culprit of the disease, the bacillus Vibrio cholera, but his work was ignored until 1885, when the renowned German physician Robert Koch, studying cholera in Egypt, made a similar discovery

[Above] “Map 1.” Printed map, 37.9 × 40.4 cm. From Snow’s Snow on Cholera . . . (1936). The map originally accompanied the second edition of Snow’s Of the Mode of Communication of Cholera (London: John Churchill, 1854).
Snow’s decisive, iconic map, showing how cholera deaths clustered around the Broad Street water pump. Using a commercial map of the Soho District, Snow stacked his black line symbols that represented individual deaths inward from the street address. This visual innovation combined an accurate location with a measure of intensity. (In another version of the map, Snow drew a dotted line of equidistance, by foot travel, between the Broad Street pump and other local pumps. Plotted cholera deaths diminished or ceased entirely at every point where residences were nearer other pumps: another visual confirmation of his argument.) Snow argued for a stringent regime of cleanliness: in the water supply, in the household (separating washing areas from cooking, etc.), and in personal hygiene.
Henry Wentworth Acland, 1815–1900
English physician and educator Henry Wentworth Acland took the cholera debate in another direction in his comprehensive study (1856) of the disease in Oxford, England. Its examination of cholera outbreaks there from 1830 to 1854—the most exhaustive of its day, using charted data and maps—concluded that altitude was more closely related to mortality from cholera than any other known factor (such as class, age, occupation, or sex). Accurate and rigorous in his mapping, Acland missed, however, the fact that people living at higher elevations usually obtained their water from aquifers or streams far removed from polluted rivers. But he was a strong advocate for improving sanitation and drainage in towns and homes as the best method for fighting the disease.
Educated at Harrow and Oxford, Acland became a physician in the Radcliffe Infirmary there and, later, was appointed to the Regius Professor of Medicine post at Oxford University. He had a large role in its school of medicine and in promoting the study of natural science. Interested in public health issues, Acland served on a royal sanitation commission and published pamphlets, as well as his landmark study, on related matters. He was a lifelong friend of the Victorian art critic John Ruskin.

Portrait of Henry Wentworth Acland. From vol. 2 of Henry Barraud’s The Medical Profession in All Countries Containing Photographic Portraits from Life (London: J. & A. Churchill, 1874).

“Map of Oxford.” Lithograph map, 45 × 62 cm. From Acland’s Memoir on the Cholera at Oxford, in the Year 1854, with Considerations Suggested by the Epidemic (London: John Churchill . . . and J. H. and J. Parker . . .; Oxford: J. H. and J. Parker, 1856) [Historic Maps Collection].
Covering three epidemics of cholera, Acland’s map relates altitude to occurrences of the disease. Black contour lines mark altitude in five-foot intervals, from the lowlands near the rivers to the town’s highest point, the summit of Carfax. Brown dots indicate spots previously described by investigators as unhealthy. Visually, it is clear that cholera affected many more people living in the low spots than in the higher areas of town, despite designations of “unhealthy.” The conclusion Acland drew was that cholera was more of a miasmatic disease that festered and settled in low-lying airs. (From today’s skeptical vantage point, Acland’s altitude scale—five feet, ten feet, fifteen feet, etc.—seems so small as to be irrelevant to any study.)

“Diagram Shewing the Daily Number of New Cases of Cholera, Choleraic Diarrhœa, and Diarrhœa Reported in Oxford, During the Epidemic of 1854, Together with the Daily Maximum of Temperature of the Air, the Amount of Rain, Degree of Moisture in the Air, the Mean Height of the Barometer, the Force and Direction of the Wind at 10 a.m. and 2 p.m., and the Amount of Cloud.” Lithograph chart, 60.2 × 42.8 cm. From Acland’s Memoir on the Cholera at Oxford . . . (1856) [Historic Maps Collection].
In discussing the tables of climatic data in his text, Acland noted the
. . . extraordinary nature of 1854. Except in the solitary condition of mean temperature, every thing is abnormal. Excessive in atmospheric pressure, and daily variations of temperature, deficient in rain and wind, abnormal in the direction of the wind, excessive in the display of electrical phenomena—as if to complete a meteorological paradox, this same year, remarkable for the abundance of its harvest, was not less remarkable for pestilence and its consequent mortality [p. 63].
Acland’s general observations provided more supporting “evidence” for miasmatic theorists, for he suggested that meteorological factors at lower altitudes could promote choleraic airs. However, in his accompanying chart, none of the data elements exhibit, in my view, any unusual activity relative to the choleraic incidents displayed in red over the epidemic period of September–October 1854.
Florence Nightingale, 1820–1910
Internationally celebrated for her pioneering nursing work in the Crimean War, Florence Nightingale is also recognized for combining statistics with sanitary reform, which she was able to dramatize with her innovative polar area diagrams. Born in Florence, Italy (her namesake), of an upper-class English family, she rejected, at an early age, the traditional expectations of her sex and status, choosing instead a life of service to the sick. Against her mother’s strong wishes, she entered nursing school in 1844 and was superintendent of the Institute for the Care of Sick Gentlewomen (London) when the Crimean War broke out in March 1854. Sent by the secretary of war to the Ottoman Empire (now Turkey), across the Black Sea from the British Army’s main camp at Balaklava (Sevastopol, Ukraine), Nightingale arrived in November with a staff of volunteer nurses she had trained herself. She earned the epithet “Lady with the Lamp” from her nighttime ministerings to the wounded at the Selimiye Barracks in Scutari, a district of modern Istanbul. Nightingale and her nurses improved conditions where limited supplies of medicine, poor hygiene, and lack of quality food had been leading to illnesses that were ten times more fatal to the men than battle wounds.

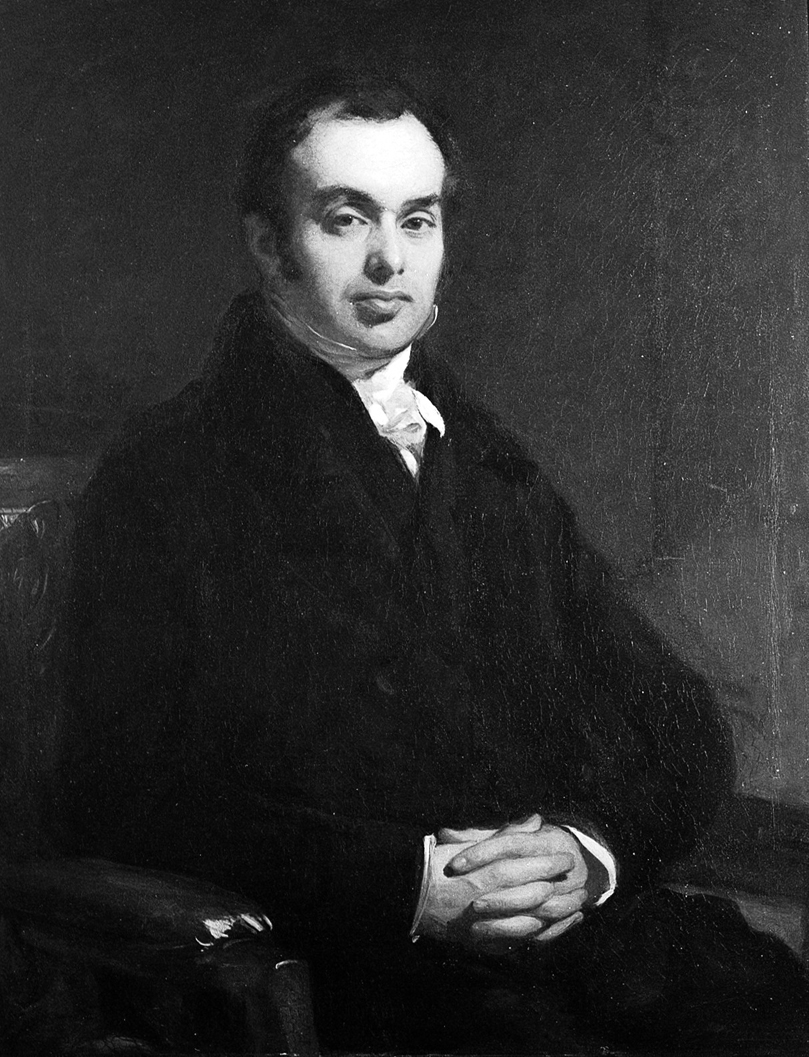
Portrait of Florence Nightingale. Undated carte de visite [Laurence Hutton Photograph Albums, Manuscripts Division].

The Nightingale Fund for training nurses was created in 1855 to recognize Nightingale’s war work. From fund donations, in 1860, she established what is now called the Florence Nightingale School of Nursing and Midwifery in London. Her Notes on Nursing (1859) is considered a classic introduction to the profession of nursing, and she also wrote on improving sanitation and administration in civilian and military hospitals. Under her father’s tutorship, Nightingale had excelled in mathematics as a youngster; in midlife she was adept at using statistics to promote her nursing agenda and was the first female elected to the Royal Statistical Society (1858). In 1907, she was also the first woman to receive the Order of Merit.
Intermittently bedridden and suffering from depression for much of her later life, Nightingale continued to be productive—in social reform, hospital planning, and nursing education. Beyond numerous monuments, museums, and memorials, Nightingale’s legacy survives in the women’s movement and global health awareness.
[Left] Title page from Mortality of the British Army: At Home, at Home [sic] and Abroad, and during the Russian War, as Compared with the Mortality of the Civil Population in England (London: Printed by Harrison and Sons, 1858) [Historic Maps Collection]. One of two thousand copies. Reprinted from the report of the royal commission appointed to inquire into the regulations affecting the sanitary state of the army. Nightingale arranged for the printing of this version of her appendix to the government’s report—the same content but with better layout.
Diagrams are of great utility for illustrating certain questions of vital statistics by conveying ideas on the subject through the eye, which cannot be so readily grasped when contained in figures” [p. 1].

“Diagram of the Causes of Mortality in the Army in the East” [Wikipedia]. From Notes on Matters Affecting the Health, Efficiency, and Hospital Administration of the British Army, a confidential report to the government that Nightingale printed privately in 1858.
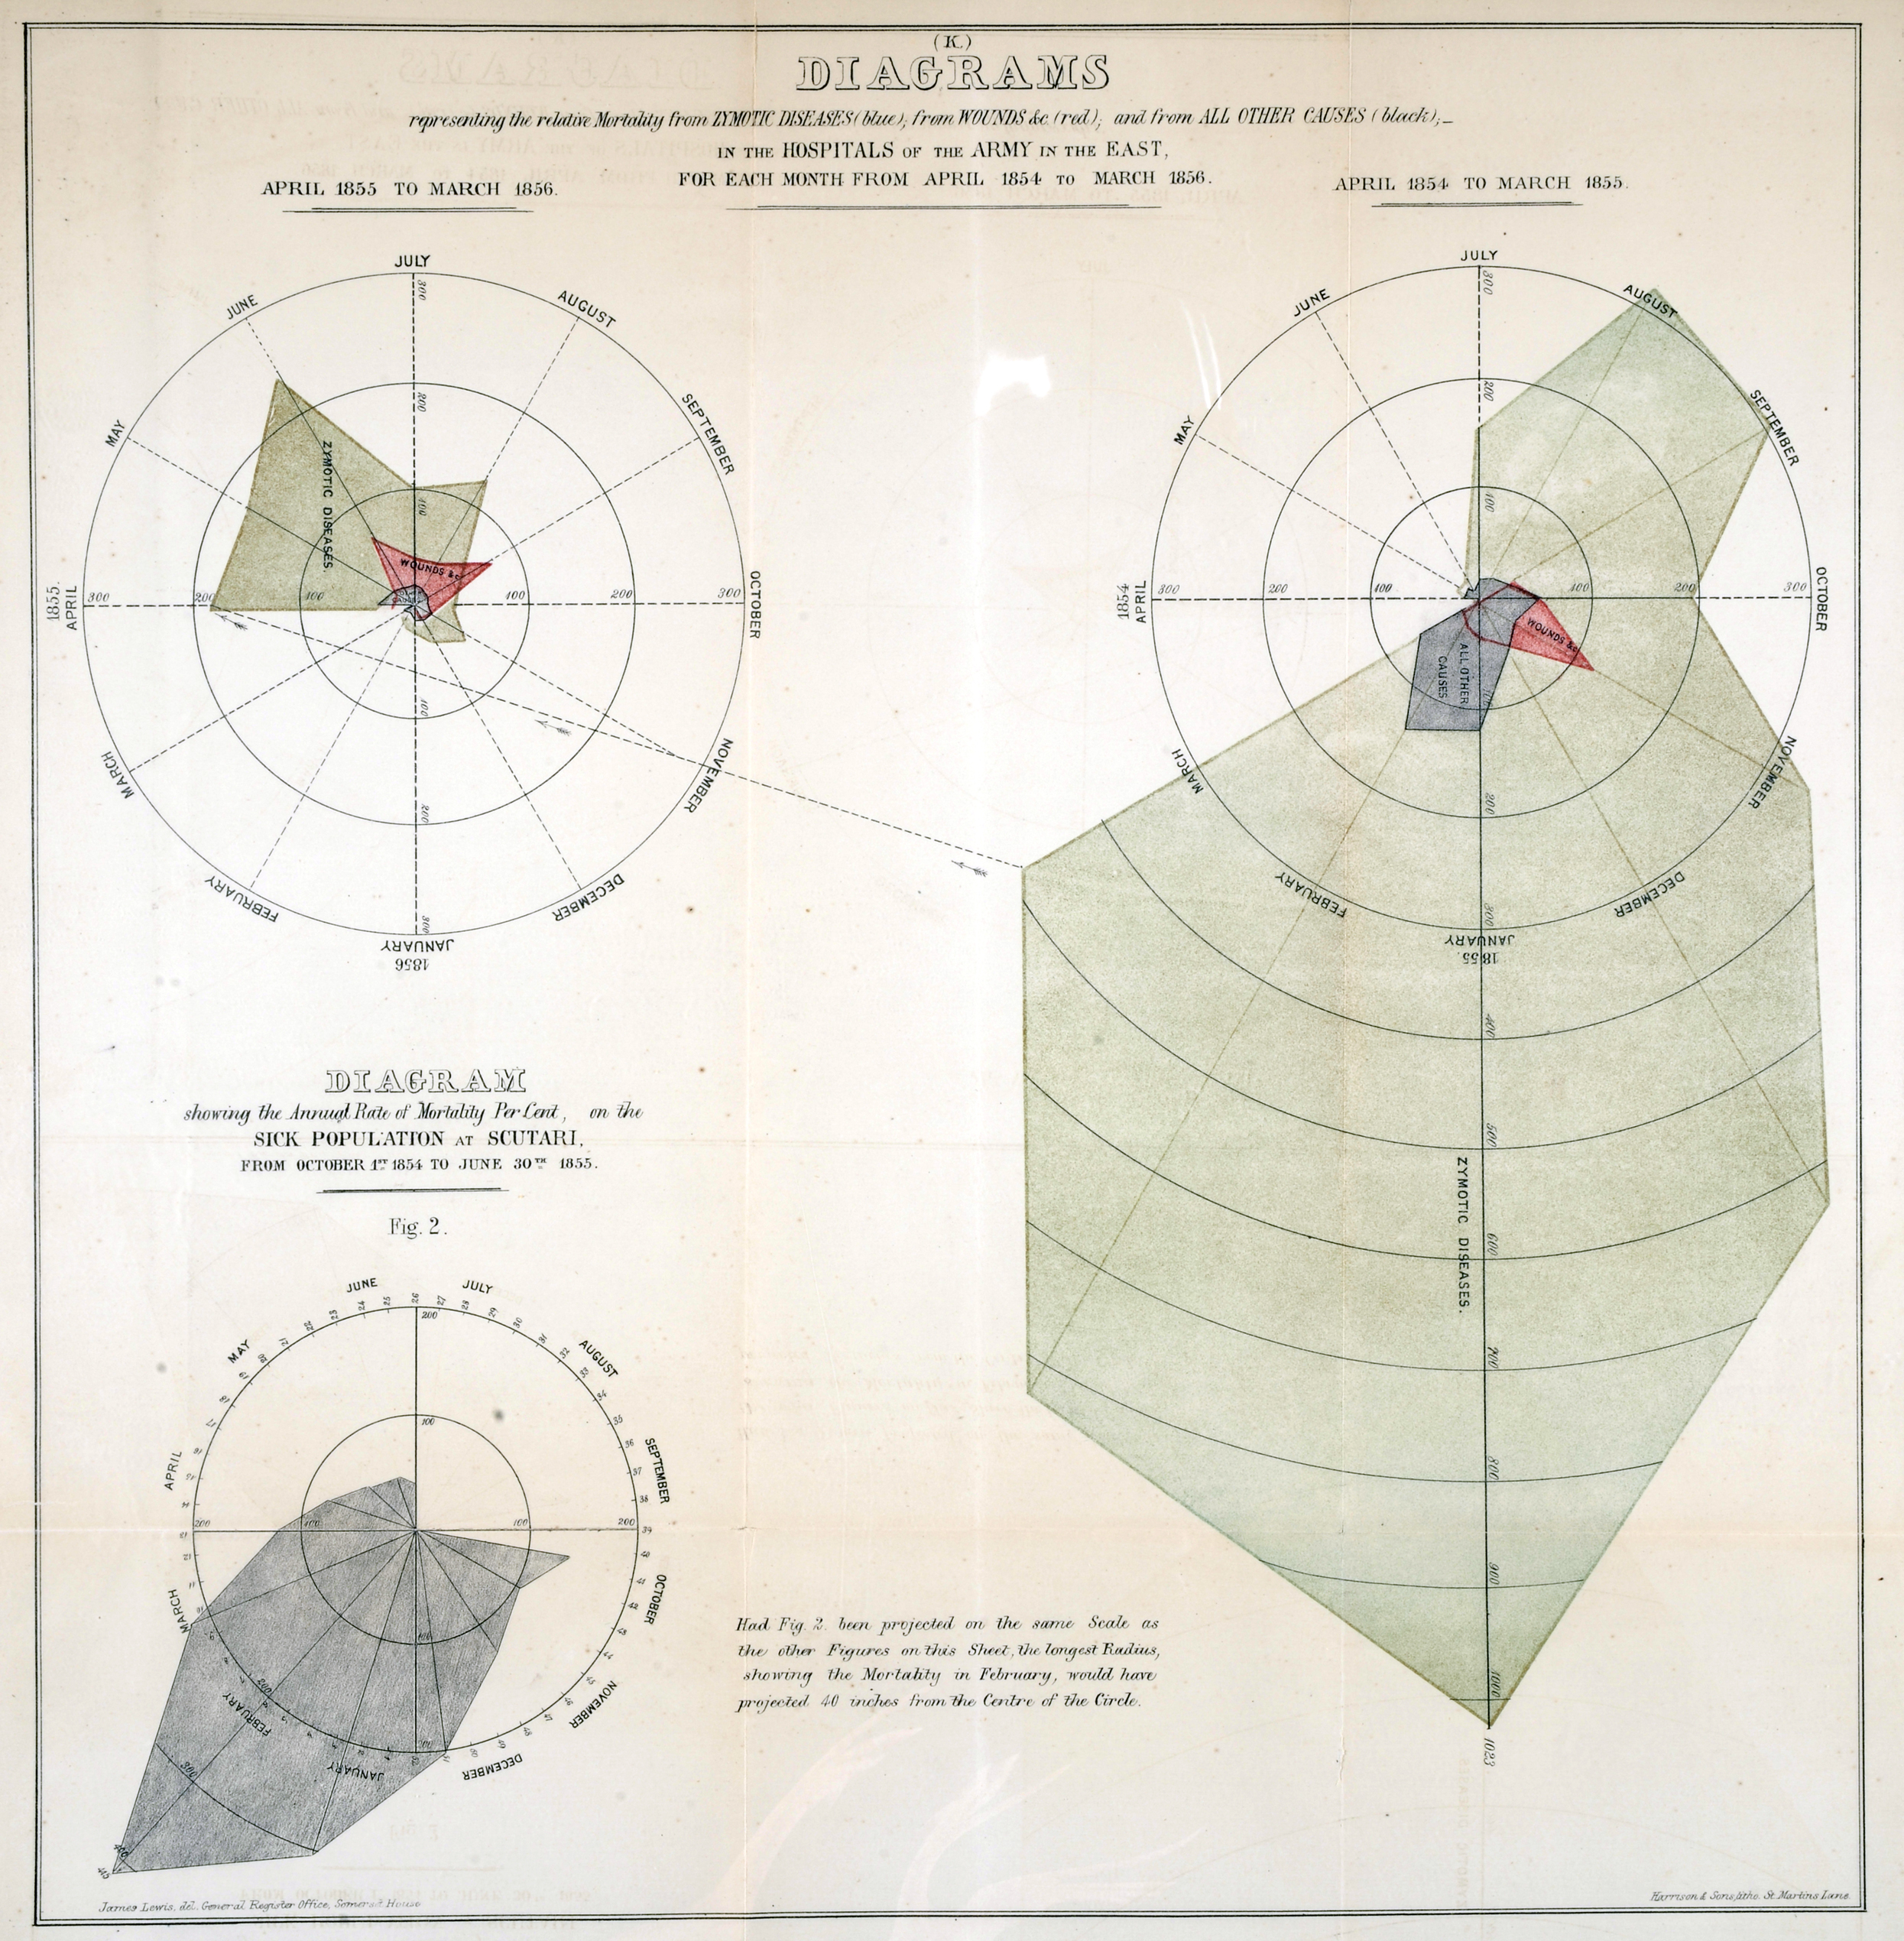
[Above, left] “(K) Diagrams Representing the Relative Mortality from Zymotic Diseases (blue [appears greenish]), from Wounds &c. (red), and from All Other Causes (black), in the Hospitals of the Army in the East, for Each Month from April 1854 to March 1856.” From Mortality of the British Army . . . (1858) [Historic Maps Collection].
Often referred to as “bat wings,” these diagrams dramatically summarize Nightingale’s argument:
The immense preponderance of zymotic diseases has been already referred to, and a glance at Diagram K will show that these diseases were the cause of the whole catastrophe. The total mortality from wounds at Alma, Inkermann, and during the five months in the trenches, exclusive of the killed in action, is all comprised in the small pink cone in the centre. The small black patch adjacent comprehends the total mortality from diseases not zymotic. The irregular blue surface, like the tail of a portentous comet, shows the zymotic diseases, the pests and scourges of camps and armies now, as they were of cities and towns in the middle ages, before the dawn of sanitary knowledge [p. 5].
However, it is the length of the radial line that is proportional to the death rate, not the area, and yet the text suggests it is the shaded areas that are proportional. Nightingale recognized this error, and in her subsequent publication replaced the “bat wings” with wedges, sometimes called “coxcombs” [above, right].